Validating the familiar Harness: Field Observations of a Cloud-Agent orchestrator with Qwen3-Coder-Next 80B / GLM-5.1
A field validation record of the familiar orchestrator / naughty / grandpa setup using a Claude orchestrator, Qwen3-Coder-Next 80B IQ4_KSS, and GLM-5.1 smol-IQ4_K. Covers the root cause behind a failed six-page generation run, observability through Grafana/DB/DCGM, and the introduction of dynamic V2 system prompts and output_file mode.

I did not want this familiar run to end as a simple “worked” or “failed.” I wanted a state where I could see where it stalled and what changed when I adjusted the system. familiar itself can switch its orchestrator between claude | codex | gemini | local LLM, but for this validation I used Claude as the orchestrator, with Qwen3-Coder-Next 80B IQ4_KSS as naughty and GLM-5.1 smol-IQ4_K as grandpa, then traced the behavior through an actual site-generation and review workload.
In the end, the initial worker backend unavailable message was not a backend outage. The real cause was that the orchestrator planned to push a large specification into a single worker call and ran into GPUTimeout=300s. To verify that, I had to look at the workspace, chat_history, Grafana session flow, and DCGM GPU monitoring together.
Validation Setup
There were three things I wanted to validate in this run.
- Can the orchestrator decompose a large specification in a contract-first way?
- Can the division of labor between
naughtyandgrandparemain observable? - When a run fails, can I prove that it was a planning problem rather than just blaming the model?
The production stack also includes a translator, but the scope of this validation was limited to orchestrator / grandpa / naughty. The older kindergarten setup has already been retired.
The role layout was as follows.
| Role | Primary responsibility | Model |
|---|---|---|
| orchestrator | Turn control, worker-call planning, dependency ordering | Claude orchestrator |
| naughty | HTML generation, direct single-file generation | Qwen3-Coder-Next 80B IQ4_KSS x 2 instance |
| grandpa | Partial review, validation, file-read-based checking | GLM-5.1 smol-IQ4_K |
| translator | Translation | Plamo-2-translate bf16 |
I do not intend to keep Plamo-2-translate for long-term use because of licensing constraints. I am currently replacing it with llm-jp/llm-jp-4-32b-a3b-base, adapted for translation with a LoRA and then quantized to nvfp4.
The target task was a six-page static dental clinic site. The workload required index.html, services.html, doctors.html, info.html, visit.html, and access.html, plus a shared header and footer, pricing tables, a modal, and a README.
The First Shape of the Failure
This was the first signal I saw.
  Status: worker execution failed after one recovery attempt.
Initial error: worker call w1 failed: worker backend unavailable
  (alias=naughty backend=vllm model=naughty): knowledge gate: llm backend unavailable:
  request vllm: Post "http://compute.home.arpa:8001/v1/chat/completions":
  context deadline exceeded (Client.Timeout exceeded while awaiting headers)
If you only read that message, it looks as if naughty itself is down. I initially suspected capacity or connectivity on the backend too. But checking backend liveness alone would not get to the real issue.
Once I opened the workspace, it became clear that the orchestrator was thinking in terms of pushing the whole six-page spec into a single worker call. The workspace already contained the parallelism information for naughty. In other words, the system had enough information to split the work, but the system prompt was not teaching the orchestrator how to do that split.
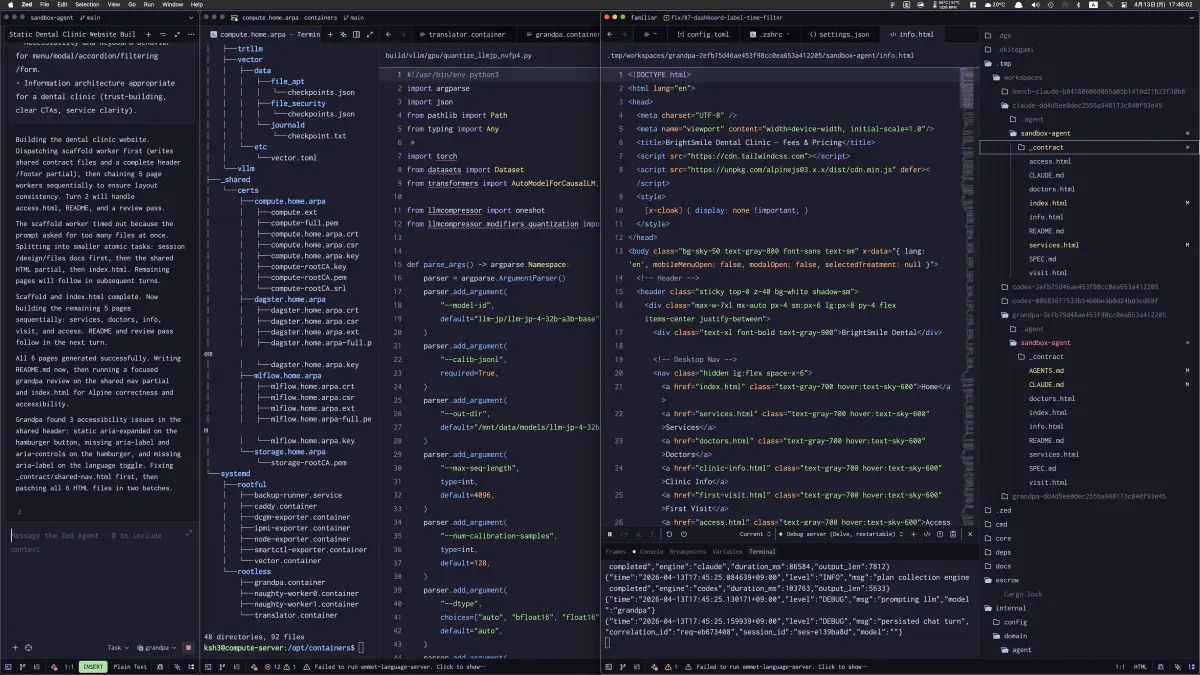
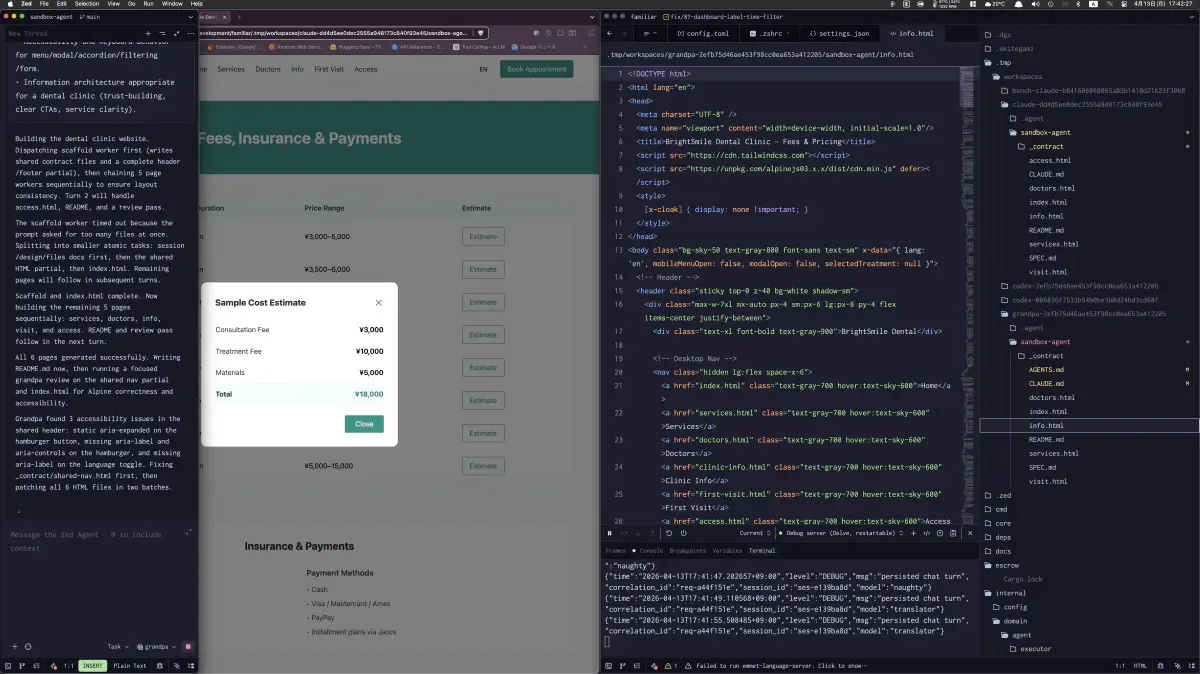
How Far the Run Had Actually Progressed
Even though the run was marked as failed, generation had already progressed partway. A page with the pricing-table modal actually rendered, and the corresponding HTML was present in info.html. The important point here was confirming that the output was not broken from the start. It was incomplete.
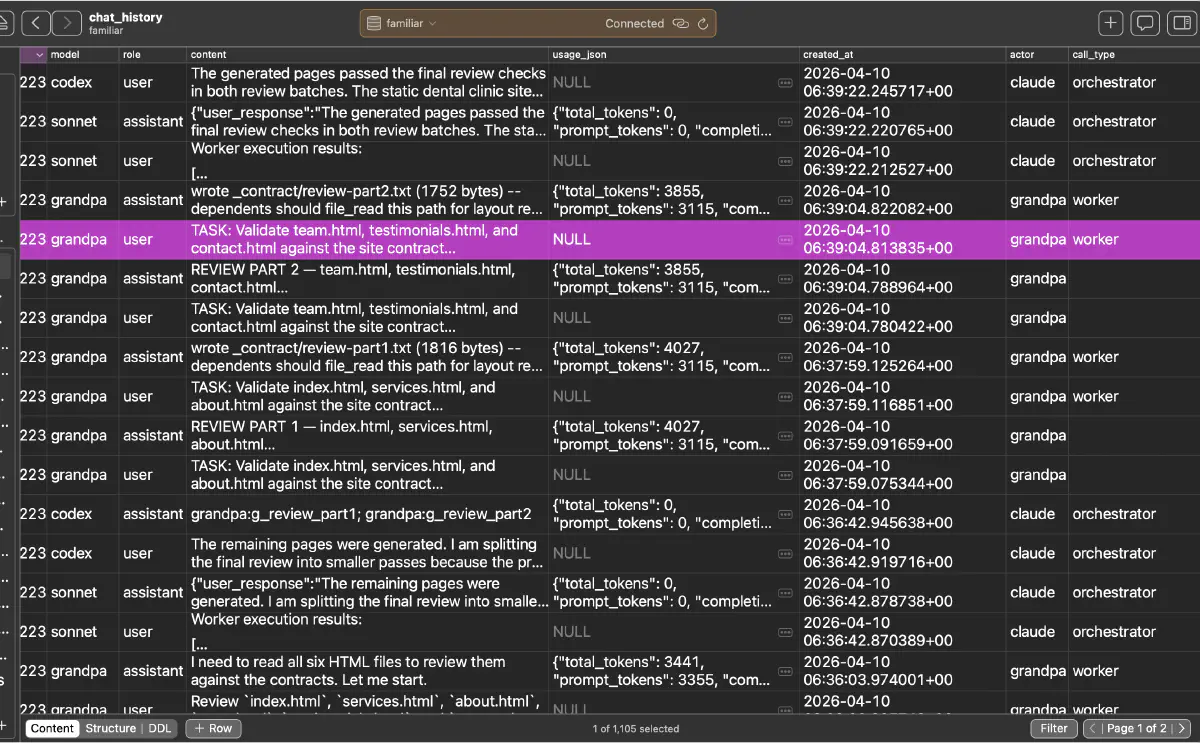
Looking at chat_history also helped. I could see the turn-by-turn exchanges and usage records for the orchestrator, grandpa, and other workers. It also showed that the review phase had already been split into two passes and that each worker left a usage JSON payload behind.
What I Used to Separate the Cause
The most important lesson from this validation was not to trust a single log stream. To avoid misclassifying the cause, I needed at least four simultaneous views.
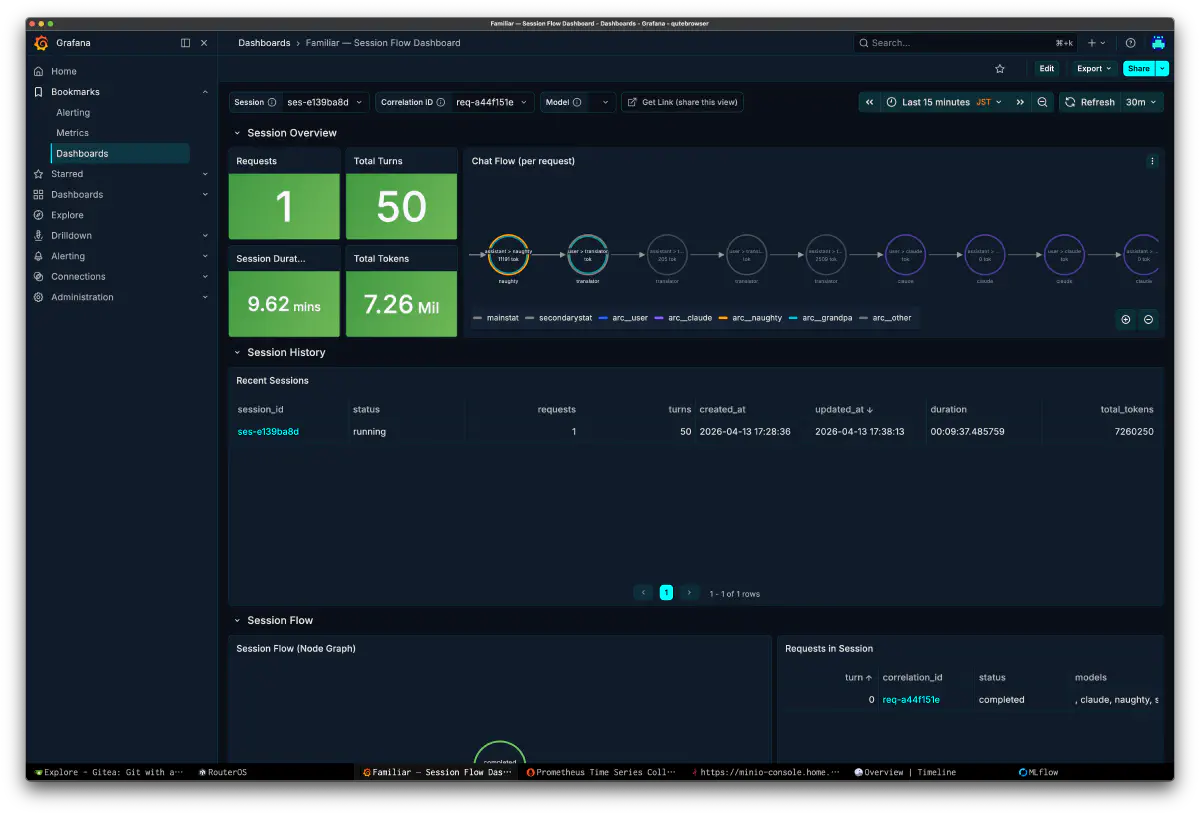
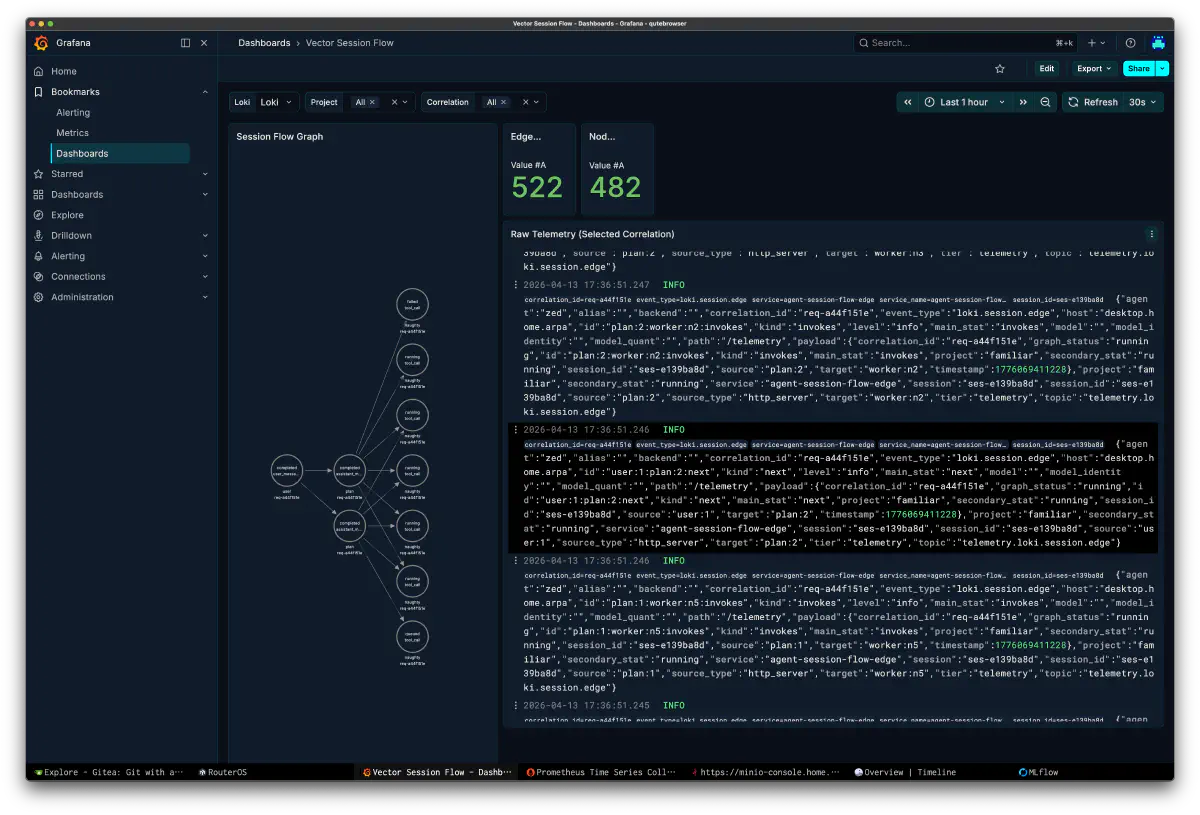
Grafana session flow showed that one request was running a heavy execution of roughly 50 turns over several minutes. At one point I misread this dashboard as 7.26M tokens, but that was caused by a wrong query condition. After fixing the query, the real token count was around 442k. The chat flow panel color-codes naughty, grandpa, and claude, so I could immediately see which role was pulling the session longest.
The Vector-side session flow graph exposed lower-level nodes and edges. It showed how the plan node branched into worker nodes and how running and queued states transitioned in raw telemetry. That made it suitable for asking a more structural question: was the orchestrator’s DAG itself flawed?
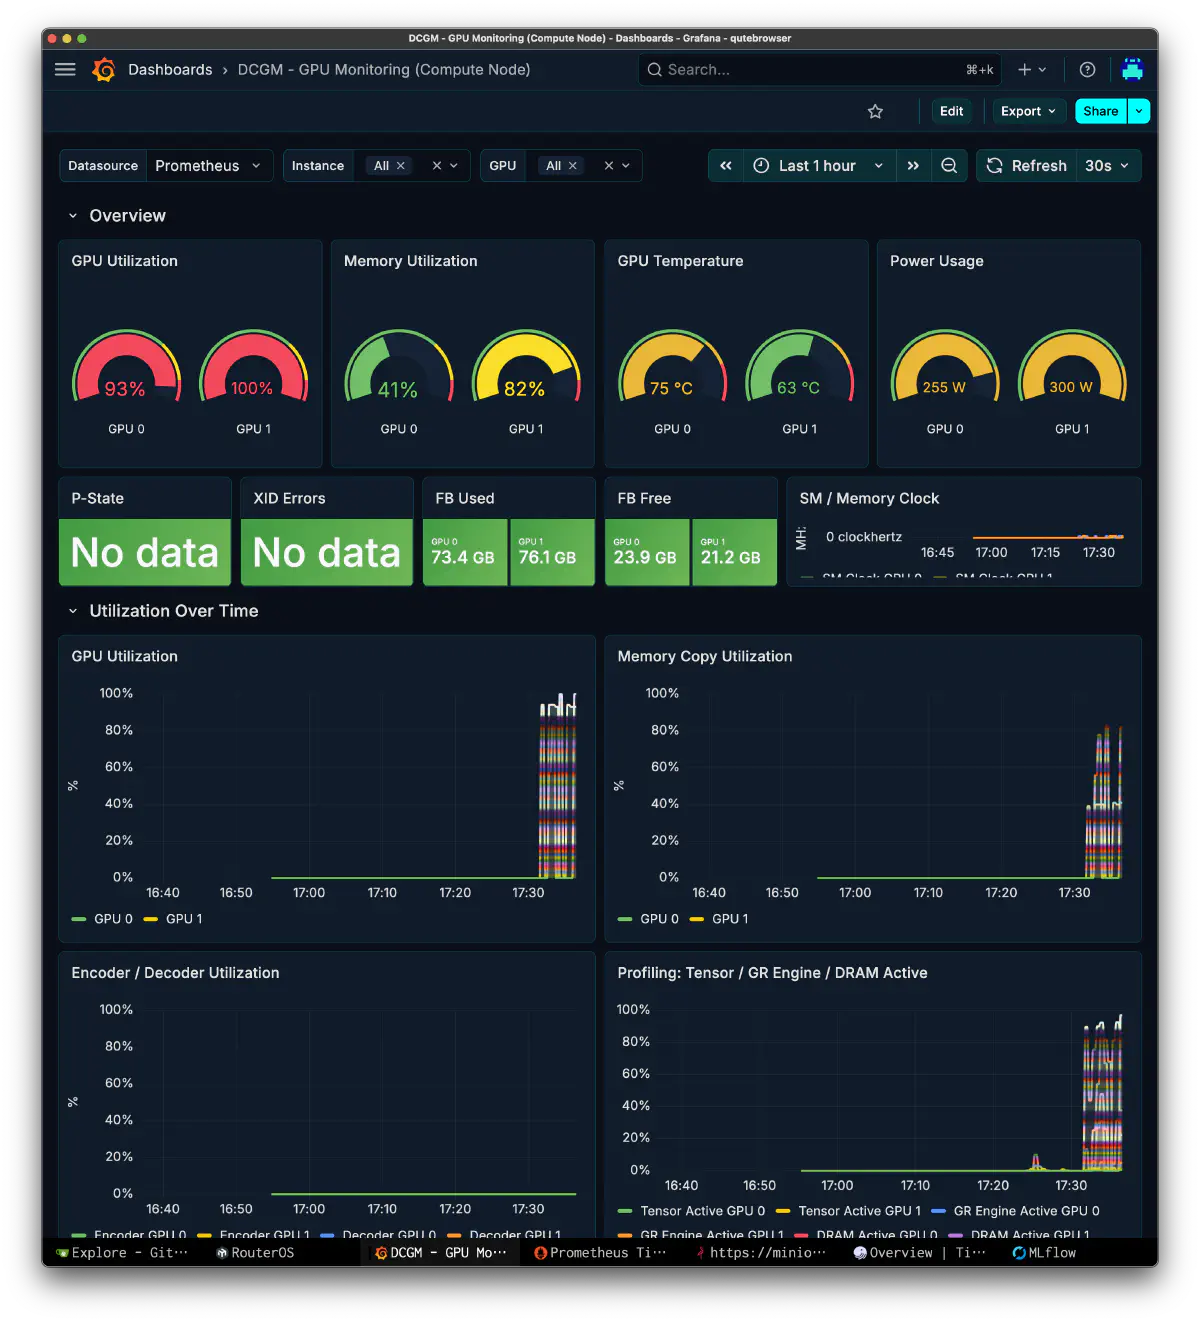
On the GPU side, I relied on DCGM. If both GPUs were clearly busy, then the problem was not “the GPUs were idle” but “the work assignment was wrong.” In this run, utilization and FB usage were both high enough that it was obvious the backend was not fully down.
Root Cause
This is how the final root-cause chain looked.
- The orchestrator was still running on a V1-style system prompt.
- That prompt did not provide enough concrete contract-first parallel design examples.
- The six-page requirement was pushed into a single oversized worker call.
naughtycould not finish within 300 seconds and hitGPUTimeout.- Recovery failed because it retried the same plan.
The worker calls I actually wanted looked more like this.
  {
  "continue": true,
  "worker_calls": [
    {
      "id": "n1",
      "alias": "naughty",
      "prompt": "Create the shared structure and landing page first.",
      "depends_on": [],
      "output_file": "index.html"
    },
    {
      "id": "g1",
      "alias": "grandpa",
      "prompt": "Review the shared contract and validate accessibility risks.",
      "depends_on": ["n1"]
    },
    {
      "id": "n2",
      "alias": "naughty",
      "prompt": "Create services.html using the shared header/footer.",
      "depends_on": ["n1"],
      "output_file": "services.html"
    }
  ]
}
Build the shared skeleton first, split downstream pages around that contract, and keep grandpa focused on review and validation. Without this structure, changing the model alone only reproduces the same class of failure.
What I Changed
The fix had three pillars.
1. Generate the System Prompt Dynamically from the Worker Pool
I moved the design toward BuildOrchestratorSystemPrompt(pool), so that the role descriptions and decomposition patterns change depending on whether naughty, grandpa, and translator are enabled. A single static file could not keep up with configuration differences in live operation. On top of that, I started preserving versioning for both final synthesis and partial synthesis so that I could observe the diffs and see which result was actually adopted. The important part was not just switching prompts, but making it possible to explain later which synthesized result was used in which turn.
2. Introduce output_file Mode
Running a full ReAct loop just to generate one file is too slow. Instead of bouncing through repeated tool calls, I added an output_file mode that writes raw text directly to a target path. That gives HTML single-file generation a path that can finish in one LLM call.
That said, this might not matter much for lighter setups like --seq=2 and --parallel 2. In my own setup, Qwen3-Coder-Next 80B IQ4_KSS runs as a two-instance backend, so I needed an explicit way to distinguish what could be shared for one goal and what had to be isolated to avoid interference. If that boundary stays ambiguous, two workers aiming at the same goal can end up touching the same file unnecessarily, or fail to share the contract they should have shared.
I have since added MCP tools to address both shared-state handling and interference avoidance. output_file was an important optimization step, but in the end I also needed boundary control for stable multi-instance backend operation.
3. Aggregate Trace Information into orchestra.log
I made the orchestrator’s system prompt, worker prompt, worker content, tool calls, tool results, and duration_ms visible in a single log. With a complex session, if you cannot read later why a given worker call was emitted, you cannot prevent the same failure from happening again.
Validation Outcome
These were the main conclusions from this run.
- The core issue was not model quality by itself, but the orchestrator’s decomposition strategy and message-stack handling.
naughty=Qwen3-Coder-Next 80B IQ4_KSS x 2 instancemakes more sense as a single-file generator.grandpa=GLM-5.1 smol-IQ4_Kis more stable when used for review, validation, and smaller scoped checks than for full-output generation.- Observability was not a side feature. It was the main path for judging whether the design was correct.
The biggest gain was being able to separate “what plan got built” from “what each role actually returned” using session flow and the database together. Instead of settling for a vague impression on one screen, I could preserve evidence distinguishing a slow backend from a bad prompt from a bad turn design.
The point I want to stress is that the real problem sits in multi-model orchestration, the harness itself. Once the models are above a certain threshold, differences in raw model quality alone do not produce dramatic changes very often. What matters much more is how the instruction chain is stacked, whether messages[N] stack operations stay stable, and how intermediate artifacts are handed over into the next turn.
In roughly one month since I started this work, I have developed nearly 20 Rust-based MCP tools in parallel, including some that were later discarded, across both local-LLM-specific and general-purpose use cases. Most of that effort was driven by one question: how far can I cut wasted context? Some of those tools have had a visibly large effect. Compared with my more recent minimax-m2.7 validation, even one-shot site generation has come down from around 150k context to around 55k.
The priority is also clear. Right now, I value “being able to trace the process in Grafana and the database” more than automatic SFT or DPO collection. At this stage, being able to explain why generation failed on a turn-by-turn basis is more valuable than merely accumulating more training data.
What Comes Next
The next questions lean less toward “which model should I pick?” and more toward “which harness remains stable under load?” If I keep tightening the orchestrator switch logic, worker role separation, message-stack compression, and observability trail one by one, the result becomes a more reusable foundation than any isolated model benchmark.
At this point I have at least clarified that this is not a “swap the model and it goes away” problem. To move familiar forward, the orchestrator first has to decompose work safely into smaller pieces, and the whole process has to stay observable in Grafana and the database. With that base finally in place, the next round of comparative experiments can start to mean something.