Gemma 4 + Dual Blackwell GPUs: Building the familiar Inference Stack and model-foundry Pipeline
Configuring the familiar inference stack with Gemma 4 on dual Blackwell GPUs. NVFP4 + vLLM vs IQ4_XS + llama.cpp, model-foundry Dagster pipeline separation, and Grafana telemetry visualization.

About This Article
A record of unifying the homelab LLM inference stack around the Gemma 4 family. Covers hardware selection, model allocation, familiar orchestrator role design, Dagster pipeline separation, and telemetry visualization – all in one flow.
Hardware: EPYC + Dual Blackwell
Compute node specs:
- CPU: AMD EPYC 9175F
- RAM: 768GB
- GPU: RTX 6000 PRO MAX-Q 96GB Blackwell x 2 (no NVLink)
I chose to run the two GPUs independently. Without NVLink, Tensor Parallel isn’t an option, but loading two separate models on separate GPUs to maximize parallel slots is more advantageous in the initial phase. The goal is data collection throughput, not single-model inference speed.
The Decision to Unify on Gemma 4
In the launch phase, I prioritized minimizing complexity over model diversity. When Gemma 4 was released, I picked the 31B dense and 26B-A4B MoE – both scoring well and fitting in GPU memory.
Data diversity from heterogeneous models is a problem for after familiar is running stably and the data pipeline is turning. Mixing multiple model families from the start means more prompt tuning and format debugging per model. First, run everything on Gemma 4 and validate the pipeline.
Model Allocation and GPU Memory Design
| slot | model | format | runtime | VRAM | parallel | GPU |
|---|---|---|---|---|---|---|
| naughty | Gemma 4 31B IT | NVFP4 | vLLM | ~17GiB | 3 | GPU0 |
| kindergarten | Gemma 4 26B-A4B IT | IQ4_XS | llama.cpp | ~13GiB | 5 | GPU1 |
GPU memory allocation:
- GPU0 (96GB): Gemma 4 31B NVFP4 ~17GiB + KV cache x 3 parallel slots (~79GB free)
- GPU1 (96GB): Gemma 4 26B-A4B IQ4_XS ~13GiB + KV cache x 6 parallel slots (~83GB free)
naughty: Gemma 4 31B NVFP4 on vLLM
NVFP4 is a TensorRT Model Optimizer format, fully optimized for Blackwell FP4 kernels. vLLM’s continuous batching maximizes throughput at parallel 3. Supports thinking mode, native function calling, and system prompts.
Benchmarks:
- AIME 2026: 89.2%
- LiveCodeBench v6: 80.0%
- Codeforces ELO: 2150
- GPQA Diamond: 84.3%
- MMLU Pro: 85.2%
AIME 89.2% from a 31B dense model is quite strong. NVFP4 quantization fitting in ~17GiB VRAM is significant – plenty of room for KV cache on a 96GB GPU.
kindergarten: Gemma 4 26B-A4B MoE on llama.cpp
26B-A4B is MoE (Mixture of Experts) with 4B active parameters. Small inference memory footprint means more parallel slots. IQ4_XS (bartowski) at ~13GiB.
ik_llama.cpp is used because MoE model inference performance is good there. vLLM excels at continuous batching for dense models, but GGUF-quantized MoE models are easier to work with on ik_llama.cpp.
familiar Model Role Design
familiar has four roles: grandpa / naughty / kindergarten / translator. Configuration is switched via CLAUDE.md:
  grandpa x naughty x kindergarten x translator    # full config
naughty x translator                              # minimal config
naughty x kindergarten x translator               # standard config
grandpa is the slot that prioritizes quality over inference speed, handling token/sec balancing. However, in the initial phase where data collection throughput is the priority, grandpa is dropped – naughty x kindergarten x translator becomes the standard config.
translator uses plamo-2-translate, a dedicated translation slot. High ja-en translation quality, used in the multilingual article pipeline.
model-foundry: Dagster Pipeline Separation
In parallel with the inference stack, I also separated the Dagster pipeline into its own repository.
The Dagster pipeline had been co-located in agent-gateway’s devstack/dagster/, but it was functioning as an independent data pipeline platform, not a gateway infrastructure addon. Separated it as model-foundry.
What DuckDB Made Visible
After separation, introducing DuckDB dramatically improved Dagster UI visibility.
Before DuckDB, each asset had to be inspected individually. After, pipeline_event_inbox_record asset STEP_OUTPUT shows event_id, subject, correlation_id as structured dicts. Pipeline execution status visible in a single screen.
A type check error appeared right after DuckDB introduction:
  dagster._core.errors.DagsterTypeCheckDidNotPass: Type check failed for step input
"pipeline_event_inbox_record" - expected type "dict".
Value of type <class 'NoneType'> failed type check
The asset was returning None when the NATS queue was empty. Fixed with proper empty event handling.
Event Name Redesign
Also cleaned up knowledge domain pipeline event names:
| Old name | New name |
|---|---|
knowledge.chat.persist | llm.chat.persist |
knowledge.embedding | obsidian.semantic_search |
knowledge.flow.lineage | llm.flow.lineage |
knowledge.tool_call | llm.tool_call |
knowledge.* was leaking knowledge domain internals. The new names express “which system is this targeting” – a topic design change. This was also a stepping stone toward the 3-domain split in the later v3 redesign.
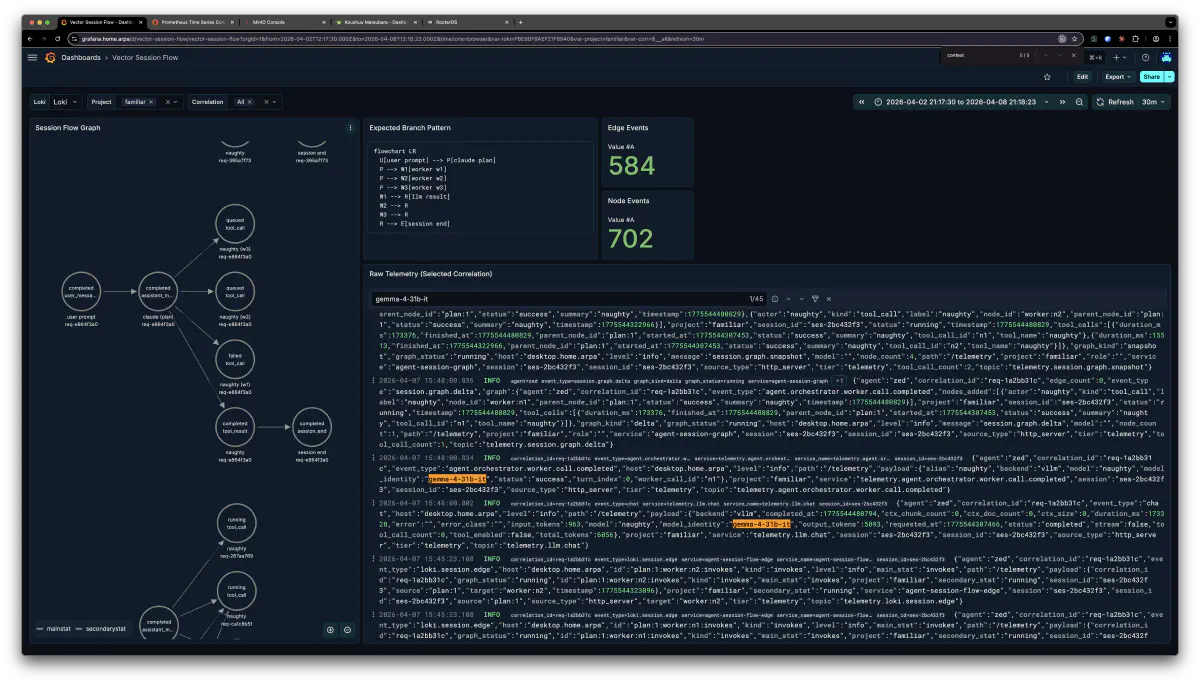
Grafana LLM Dashboard
Telemetry from the inference stack is visualized in Grafana.
Data Flow
familiar -> Vector (HTTP port 8687 /telemetry) -> Prometheus / Loki -> Grafana
Rendering principles:
- Grafana renders from real-time data via Vector (does not query PostgreSQL directly)
- Persistence goes flat into PostgreSQL
- Summarization needs are handled by Dagster + DuckDB
Vector’s http_telemetry source receives familiar’s telemetry events, handling Prometheus metric forwarding and Loki log storage simultaneously. Sessions can be traced end-to-end via correlation_id.
Vector configuration:
  [sources.http_telemetry]
type = "http_server"
address = "0.0.0.0:8687"
path = "/telemetry"
encoding = "json"
Telemetry events from familiar are POSTed as JSON. Vector receives them and runs Prometheus metric transformation and Loki log forwarding in parallel. The Grafana dashboard combines these two data sources to render real-time inference performance and session flows.
Impressions from Actually Running Gemma 4
Tested with nvidia/gemma-4-31b-it-nvfp4 on vLLM at --max-num-seqs 3, and ik_llama.cpp gemma4 branch with Q4_K_L at --parallel 5. Queueing controlled via Go channels, pushing full concurrency.
As it turned out, the orchestrator model didn’t route to the 26B MoE side (kindergarten), so the only configuration I could test was 31B IT x 3 in parallel. The deliverables came out complete, but lacked coherence.
I expected KV cache co-location to nudge the outputs toward similar directions, but it didn’t really matter in practice. Even with the same planning passed to all three workers, coordination wasn’t there. Each worker proceeded with inference independently, resulting in one worker ignoring decisions made by another.
Lesson learned: for coding tasks specifically, any-to-any generalist models should only be used for the orchestrator. Workers need constrained prompts and context to maintain quality in parallel execution. Parallelism is effective for data collection throughput, but if you expect coherent collaborative output, the orchestrator design needs to come first.
After That: GLM-5.1 + Qwen3-Coder-Next Configuration
After this experiment, GLM-5.1 was released at just the right time for the grandpa role. I swapped out Kimi-K2.5, combined it with the coding-oriented Qwen3-Coder-Next, and got significantly better results.
  dev0 / GLM-5.1 (grandpa)
  PP:  340 tok/s
  TG:  12-16 tok/s

dev0 / Qwen3-Coder-Next (worker-0)
  PP:  2500 tok/s
  TG:  114 tok/s

dev1 / Qwen3-Coder-Next (worker-1)
  PP:  5100 tok/s
  TG:  161 tok/s

dev1 / PLaMo2Translate (translator)
  PP:  100-240 tok/s
  TG:  35-140 tok/s
The configuration with a high-reasoning model as orchestrator and coding-specialized models as workers showed clearly better coordination than the Gemma 4 unified setup. Details of this configuration for another time.