
DeepSeek V4 Flash 0731: vLLM measurements and CPU KV offload
DeepSeek V4 Flash 0731 on two RTX PRO 6000 96GB GPUs: DSpark K5 throughput, CPU KV offload, and a generated business application.

I ran DeepSeek V4 Flash 0731 on two RTX PRO 6000 Blackwell Max-Q 96GB GPUs. The runtime stack was custom vLLM Gilded Gnosis r24 with Tensor Parallel 2, DSpark K5, FP8 compressed MLA KV, and native CPU KV offload.
The following video covers the coding-agent workload from execution through inspection of the generated artifacts.
Video link: https://www.youtube.com/watch?v=E7JroDgE9no
The server started with MAX_MODEL_LEN=262144 and exposed 285,336 GPU KV cache tokens. A single 262,144-token request therefore has a theoretical concurrency of 1.09x. On the coding-agent workload, generation throughput peaked at 359.0 tok/s, while the median for a single active request was 230.9 tok/s.
Results
| Item | Measured value |
|---|---|
| Model | deepseek-ai/DeepSeek-V4-Flash-0731 |
| Runtime | vLLM Gilded Gnosis r24 |
| GPU | RTX PRO 6000 Blackwell Max-Q 96GB x2 |
| Tensor Parallel / DCP | 2 / 1 |
| Expert path | model-native FP4 / B12X W4A8 |
| KV cache | FP8 DeepSeek compressed MLA |
| Configured context | 262,144 |
| Maximum sequences | 2 |
| GPU KV capacity | 285,336 tokens |
| 262K request concurrency | 1.09x |
| Peak GPU KV usage | 79.4% |
| Peak generation throughput | 359.0 tok/s |
| Single-active-request median | 230.9 tok/s |
| Single-active-request IQR | 167.9-279.3 tok/s |
| Nonzero-window mean | 205.6 tok/s |
| Peak prompt throughput | 5,790.1 tok/s |
| DSpark acceptance length | median 5.12 / best 5.90 |
| DSpark draft acceptance | median 82.4% / best 98.1% |
| CPU KV offload | 8 GiB total across TP ranks |
| Observed KV copy rate | approximately 50-55 GB/s |
| Captured access-log results | 101 / 101 HTTP 200 |
Codex aggregated throughput and DSpark statistics from vLLM server logs.
How This Differs from Earlier DeepSeek V4 Flash Articles
Previously, I ran a Q2 GGUF build on a single GPU with the dedicated DwarfStar 4 runtime and also distributed it across two compute nodes as an orchestrator.
This run used DeepSeek-V4-Flash-0731 with these changes:
- The runtime is custom vLLM rather than DwarfStar 4
- The checkpoint is
DeepSeek-V4-Flash-0731 - The expert weights are model-native FP4
- The model runs on two RTX PRO 6000 GPUs in one host rather than on a single GPU
- DSpark K5 speculative decoding is enabled
- The GPU KV cache uses FP8 compressed MLA
- Native CPU KV offload uses
/dev/shm
Validation Environment
| Item | Configuration |
|---|---|
| Host CPU | AMD EPYC 9175F |
| Host RAM | 768GB DDR5 ECC |
| GPU | NVIDIA RTX PRO 6000 Blackwell Max-Q Workstation Edition x2 |
| VRAM | 96GB x2 |
| GPU link | PCIe 5.0 x16 |
| OS | Ubuntu 24.04 |
| Container | Podman / Quadlet |
| Model | deepseek-ai/DeepSeek-V4-Flash-0731 |
| Model snapshot | 7872f01b1d1fe23eabc4c98b48bffcef5a386062 |
| Image used | registry.home.arpa/vllm:deepseek-v4 |
| Base release | Gilded Gnosis v20 r24 |
| Runtime version | v0.11.2.dev280 custom build |
The vLLM version that actually started was:
  Aug 04 01:45:09 compute-server grandpa[415455]: (APIServer pid=52) INFO 08-04 01:45:09 [api_utils.py:345]  ▄▄ ▄█ █     █     █ ▀▄▀ █  version 0.11.2.dev280+gilded.gnosis.v20.vllmf5981f1.si2b9bf2a.fi801d57a.cu132.20260803.r24
Aug 04 01:45:09 compute-server grandpa[415455]: (APIServer pid=52) INFO 08-04 01:45:09 [api_utils.py:345]   █▄█▀ █     █     █     █  model   /models/snapshots/7872f01b1d1fe23eabc4c98b48bffcef5a386062
The release image behind the private mirror was this build:
  voipmonitor/vllm:gilded-gnosis-v20-vllmf5981f1-si2b9bf2a-fi801d57a-cu132-20260803-r24
Docker manifest: sha256:64b94299abdd3bcf5bb5050ca91b378f9ee4e0b0eff4748375b95352371d7cb2
Local image ID: sha256:dc0bc459b8c1d59f84e945a4b77f65ea474778b58f4a95d3e3d1c97632daeb1d
Model-Native FP4 Experts and B12X W4A8
The expert weights are model-native FP4; this is not a generic post-training Q4 conversion. The startup log also confirms FP4 experts, W4A8, compressed MLA KV, and the FP8 Lightning Indexer.
  (Worker_TP0 pid=496) INFO [quant_config.py:75] DeepSeek V4 expert_dtype resolved to 'fp4'
(Worker_TP0 pid=496) INFO [attention.py:98] Using DeepSeek's fp8_ds_mla KV cache format.
(Worker_TP0 pid=496) INFO [mxfp4.py:426] Using 'B12X' Mxfp4 MoE backend.
(Worker_TP0 pid=496) INFO [attention.py:1023] Using FP8 indexer cache for Lightning Indexer.
(Worker_TP0 pid=496) WARNING [b12x_moe.py:810] B12X MoE force-A8 enabled: using quant_mode=w4a8_mx for E8M0 FP4 weights.
Model loading used the InstantTensor BUFFERED backend. Model weights occupied 81.01 GiB on each GPU.
DSpark K5
K5 is a fixed-depth profile in which DSpark proposes five draft tokens in each verification step.
  Environment=MODE=dspark
Environment=DSPARK_DEPTH_MODE=fixed
Environment=DSPARK_TOKENS=5
With this configuration, the effective scheduled-token budget was 8,184 rather than MAX_NUM_BATCHED_TOKENS=8192, after subtracting the slots needed for speculative decoding.
Aug 04 02:44:37 compute-server grandpa[572062]: (EngineCore pid=179) WARNING 08-04 02:44:37 [vllm.py:1758] max_num_scheduled_tokens is set to 8184 based on the speculative decoding settings. This may lead to suboptimal performance. Consider increasing max_num_batched_tokens to accommodate the additional draft token slots, or decrease num_speculative_tokens or max_num_seqs.
In this run, acceptance length reached 5.90 while Current speculative depth: 5. The metric includes the normal target token in addition to the five draft tokens. Draft acceptance remained prompt-dependent and was not always high.
Quadlet
The image uses serve-ds4-flash.sh to build the vLLM arguments, SparkInfer backend, and DSpark settings from environment variables instead of accepting arguments through vllm-openai.
The Quadlet Exec therefore consists of one line:
Exec=/usr/local/bin/serve-ds4-flash.sh
This is the Quadlet configuration I used:
  [Unit]
Description=DeepSeek V4 Flash 0731 / DSpark r24
After=network-online.target
Wants=network-online.target

[Container]
ContainerName=grandpa
Image=registry.home.arpa/vllm:deepseek-v4
Pull=always

Network=host
AddDevice=nvidia.com/gpu=0
AddDevice=nvidia.com/gpu=1
PodmanArgs=--ipc=host --privileged
RunInit=true

Volume=/mnt/data/hf/hub/models--deepseek-ai--DeepSeek-V4-Flash-0731:/models:ro
Volume=/mnt/data/hf/jit/ds4-v20-r24:/cache
Volume=/mnt/data/hf/tmp/ds4-v20-r24:/container-tmp

Environment=BACKEND=b12x-a8
Environment=CUDA_VISIBLE_DEVICES=0,1
Environment=DCP_SIZE=1
Environment=DSPARK_DEPTH_MODE=fixed
Environment=DSPARK_TOKENS=5
Environment=GPU_MEMORY_UTILIZATION=0.975
Environment=INSTANTTENSOR_BACKEND=BUFFERED
Environment=KV_OFFLOADING_SIZE=8
Environment=LOAD_FORMAT=instanttensor
Environment=MAX_MODEL_LEN=262144
Environment=MAX_NUM_BATCHED_TOKENS=8192
Environment=MAX_NUM_SEQS=2
Environment=MODE=dspark
Environment=MODEL_PATH=/models/snapshots/7872f01b1d1fe23eabc4c98b48bffcef5a386062
Environment=PORT=8000
Environment=SERVED_MODEL_NAME=grandpa
Environment=TP_SIZE=2

Ulimit=memlock=-1:-1
Ulimit=nofile=1048576:1048576
Ulimit=stack=67108864:67108864

Exec=/usr/local/bin/serve-ds4-flash.sh

[Service]
ExecStartPre=/usr/bin/mkdir -p /mnt/data/hf/jit/ds4-v20-r24 /mnt/data/hf/tmp/ds4-v20-r24
TimeoutStartSec=3600
TimeoutStopSec=120
Restart=on-failure
RestartSec=30
LimitMEMLOCK=infinity
LimitNOFILE=1048576
LimitSTACK=67108864
Podman rejects --ipc=host together with ShmSize=. Choose host IPC or a container-specific shared-memory size.
--privileged records the startup settings used for this test; it is not a least-privilege setup.
GPU Memory and KV Capacity
After graph capture, the per-GPU breakdown was:
| Item | Per GPU |
|---|---|
| Model weights | 81.01 GiB |
| Peak activation | 2.45 GiB |
| Non-torch memory | 0.20 GiB |
| CUDA graph | 0.14 GiB |
| GPU KV cache | 8.59 GiB |
The raw log records both the memory breakdown and KV capacity in the same startup sequence.
  Aug 04 02:44:21 compute-server grandpa[572062]: (Worker_TP0 pid=264) INFO 08-04 02:44:21 [gpu_worker.py:617] Available KV cache memory: 8.59 GiB
Aug 04 02:44:21 compute-server grandpa[572062]: (EngineCore pid=179) INFO 08-04 02:44:21 [kv_cache_utils.py:2428] GPU KV cache size: 285,336 tokens
Aug 04 02:44:21 compute-server grandpa[572062]: (EngineCore pid=179) INFO 08-04 02:44:21 [kv_cache_utils.py:2429] Maximum concurrency for 262,144 tokens per request: 1.09x
Aug 04 02:44:27 compute-server grandpa[572062]: (Worker_TP0 pid=264) INFO 08-04 02:44:27 [gpu_worker.py:918] Free memory on device (93.73/94.97 GiB) on startup. Desired GPU memory utilization is (0.975, 92.59 GiB). Actual usage is 81.01 GiB for weight, 2.45 GiB for peak activation, 0.2 GiB for non-torch memory, and 0.14 GiB for CUDAGraph memory. Replace gpu_memory_utilization config with `--kv-cache-memory-bytes=9288604570` (8.65 GiB) to fit into requested memory, or `--kv-cache-memory-bytes=10511114752` (9.79 GiB) to fully utilize gpu memory. Current kv cache memory in use is 8.59 GiB.
Aug 04 02:44:36 compute-server grandpa[572062]: (EngineCore pid=179) INFO 08-04 02:44:36 [core.py:345] init engine (profile, create kv cache, warmup model) took 47.53 s (compilation: 12.64 s)
Allocating the Active Sequence Budget
Treating GPU KV conservatively as an approximately 256K active working set gives this proposed allocation:
| Active sequences | Approximate total tokens per sequence |
|---|---|
| 1 | 256K |
| 2 | 128K |
| 4 | 64K |
Here, total tokens means the current prompt plus generated output, not input alone. A sequence with a 64K input and another 32K of generated output consumes 96K.
For more flexible operation, I could keep MAX_MODEL_LEN=262144, raise MAX_NUM_SEQS to 4, and have the agent loop or orchestrator limit the aggregate active-sequence token budget.
sum(active prompt tokens + generated tokens + output headroom) <= approximately 256K
Native CPU KV Offload
KV_OFFLOADING_SIZE=8 creates one 8 GiB host-RAM pool shared by TP0 and TP1.
  Aug 04 02:44:22 compute-server grandpa[572062]: (Worker_TP0 pid=264) INFO 08-04 02:44:22 [shared_offload_region.py:85] Created mmap file /dev/shm/vllm_offload_f5388900-1119-46b2-b2eb-178e4b7e21c5.mmap (8.59 GB)
Aug 04 02:44:22 compute-server grandpa[572062]: (Worker_TP1 pid=265) INFO 08-04 02:44:22 [shared_offload_region.py:93] Opened existing mmap file /dev/shm/vllm_offload_f5388900-1119-46b2-b2eb-178e4b7e21c5.mmap
Aug 04 02:44:22 compute-server grandpa[572062]: (Worker_TP0 pid=264) INFO 08-04 02:44:22 [shared_offload_region.py:176] Unlinked mmap file /dev/shm/vllm_offload_f5388900-1119-46b2-b2eb-178e4b7e21c5.mmap after 2 workers mapped it
Although the log calls it an mmap file, it is not writing to SSD. /dev/shm is normally tmpfs backed by host DRAM. Transfers between that memory and the GPU travel over PCIe 5.0 x16.
Calculating bytes / recorded copy time from the transfer metrics gives a weighted store rate of 54.38 GB/s and a weighted load rate of 51.46 GB/s.
| Direction | Weighted rate | Observed range |
|---|---|---|
GPU to host RAM (store) | 54.38 GB/s | 52.09-55.56 GB/s |
Host RAM to GPU (load) | 51.46 GB/s | 48.02-54.91 GB/s |
The largest store interval transferred 1.415 GB in 27.17 ms. The largest load interval transferred 185.3 MB in 3.37 ms.
  Aug 04 02:49:49 compute-server grandpa[572062]: (APIServer pid=53) INFO 08-04 02:49:49 [metrics.py:103] KV Transfer metrics: vllm:kv_offload_store_bytes=1415335680, vllm:kv_offload_store_time=0.027173248052597042, vllm:kv_offload_store_size_count=18, vllm:kv_offload_store_size_sum=1415335680, vllm:kv_offload_cpu_cache_usage_perc=0.0, vllm:kv_offload_cpu_allocation_size_count=7, vllm:kv_offload_cpu_allocation_size_sum=503, vllm:kv_offload_cpu_cache_write_usage_perc=0.0, vllm:kv_offload_cpu_cache_read_usage_perc=0.0
Aug 04 02:49:59 compute-server grandpa[572062]: (APIServer pid=53) INFO 08-04 02:49:59 [metrics.py:103] KV Transfer metrics: vllm:kv_offload_cpu_cache_usage_perc=0.0, vllm:kv_offload_cpu_cache_write_usage_perc=0.0, vllm:kv_offload_cpu_cache_read_usage_perc=0.0, vllm:kv_offload_lookup_sync_delay_seconds_count=5, vllm:kv_offload_lookup_sync_delay_seconds_sum=9.603999751561787e-05, vllm:kv_offload_load_bytes=185264640, vllm:kv_offload_load_time=0.0033739200830459597, vllm:kv_offload_load_size_count=2, vllm:kv_offload_load_size_sum=185264640, vllm:kv_offload_cpu_allocation_size_count=5, vllm:kv_offload_cpu_allocation_size_sum=139, vllm:kv_offload_store_bytes=299439360, vllm:kv_offload_store_time=0.005468831906095147, vllm:kv_offload_store_size_count=10, vllm:kv_offload_store_size_sum=299439360
The raw one-way bandwidth of PCIe 5.0 x16 is approximately 64 GB/s, so an observed 50-55 GB/s is not an implausible result.
Peak kv_offload_cpu_cache_usage_perc was about 3.86%. The workload confirmed the offload path but did not fill the 8 GiB pool or test a large CPU tier.
What 768GB of RAM Adds: KV Storage Capacity
The host has 768GB RAM. CPU offload adds storage for reusable prefix KV, not a larger per-request context or more active GPU KV.
In this configuration, 17.18 GiB of total GPU KV across TP2 corresponds to 285,336 logical tokens. Assuming the CPU tier preserves the same KV block layout, a 512 GiB CPU pool has the following storage equivalent:
  285,336 tokens x (512 GiB / 17.18 GiB)
  = approximately 8.5 million token-block equivalents
The simple conversion gives about 32 histories of 262,144 tokens, not 32 concurrent requests. Reuse requires copying KV back over PCIe. Block rounding, metadata, eviction, and shared prefixes affect actual storage.
This native offload path moves inactive prefix KV to the CPU for later reuse; it does not continue an active request entirely from CPU memory. Increasing KV_OFFLOADING_SIZE to 512 GiB alone does not change:
MAX_MODEL_LEN- The 285,336-token GPU KV cache
- The GPU-resident active working set
- The configured
MAX_NUM_SEQS
A 512 GiB shared mmap also requires sufficient /dev/shm capacity, actual free RAM, memlock allowance, and successful CUDA host registration.
df -h /dev/shm
This is an upper-bound estimate from the 8 GiB run. Startup, latency, and capacity with 512 GiB are untested.
Generation Throughput and DSpark Acceptance
I aggregated the vLLM metrics in 10-second windows.
- Median and Tukey IQR come from 22 windows with
Running: 1 - The nonzero mean comes from 34 windows with nonzero generation throughput
- Acceptance statistics come from 34 windows containing DSpark metrics
- CPU KV bandwidth is
sum(bytes) / sum(recorded transfer time)
| Metric | Value |
|---|---|
| Peak generation throughput | 359.0 tok/s |
| Single-active-request median | 230.9 tok/s |
| Single-active-request IQR | 167.9-279.3 tok/s |
| Mean across nonzero windows | 205.6 tok/s |
| Peak prompt throughput | 5,790.1 tok/s |
| Acceptance length median | 5.12 |
| Acceptance length mean | 4.86 |
| Acceptance length best | 5.90 |
| Draft acceptance median | 82.4% |
| Draft acceptance mean | 77.2% |
| Draft acceptance best | 98.1% |
| Draft acceptance range | 41.9-98.1% |
| Accepted speculative throughput median | 161.2 tok/s |
| Accepted speculative throughput best | 298.2 tok/s |
In the window where DSpark was most effective, generation throughput reached 359.0 tok/s with 98.1% draft acceptance.
  Aug 04 02:46:09 compute-server grandpa[572062]: (APIServer pid=53) INFO 08-04 02:46:09 [loggers.py:314] Engine 000: Avg prompt throughput: 0.0 tokens/s, Avg generation throughput: 359.0 tokens/s, Running: 1 reqs, Waiting: 0 reqs, GPU KV cache usage: 1.9%, Prefix cache hit rate: 88.1%, External prefix cache hit rate: 0.8%
Aug 04 02:46:09 compute-server grandpa[572062]: (APIServer pid=53) INFO 08-04 02:46:09 [metrics.py:125] SpecDecoding metrics: Mean acceptance length: 5.90, Current speculative depth: 5, Accepted throughput: 298.18 tokens/s, Drafted throughput: 303.98 tokens/s, Accepted: 2982 tokens, Drafted: 3040 tokens, Per-position acceptance rate: 1.000, 0.998, 0.993, 0.972, 0.941, Avg Draft acceptance rate: 98.1%
For some prompts, acceptance fell as low as 41.9%.
  Aug 04 02:47:59 compute-server grandpa[572062]: (APIServer pid=53) INFO 08-04 02:47:59 [loggers.py:314] Engine 000: Avg prompt throughput: 0.0 tokens/s, Avg generation throughput: 193.9 tokens/s, Running: 1 reqs, Waiting: 0 reqs, GPU KV cache usage: 3.3%, Prefix cache hit rate: 95.2%, External prefix cache hit rate: 9.3%
Aug 04 02:47:59 compute-server grandpa[572062]: (APIServer pid=53) INFO 08-04 02:47:59 [metrics.py:125] SpecDecoding metrics: Mean acceptance length: 3.09, Current speculative depth: 5, Accepted throughput: 131.19 tokens/s, Drafted throughput: 313.47 tokens/s, Accepted: 1312 tokens, Drafted: 3135 tokens, Per-position acceptance rate: 0.789, 0.542, 0.362, 0.247, 0.152, Avg Draft acceptance rate: 41.9%
The peak is 359 tok/s, but throughput depends on acceptance. The single-active-request median of about 231 tok/s is the more useful central value for this workload.
The 5,790.1 tok/s prompt-throughput value is a window peak from a mixed long-context workload, not an independent fixed-length prefill benchmark.
  Aug 04 02:49:39 compute-server grandpa[572062]: (APIServer pid=53) INFO 08-04 02:49:39 [loggers.py:314] Engine 000: Avg prompt throughput: 2649.6 tokens/s, Avg generation throughput: 107.1 tokens/s, Running: 1 reqs, Waiting: 0 reqs, GPU KV cache usage: 79.4%, Prefix cache hit rate: 95.9%, External prefix cache hit rate: 3.7%
Aug 04 02:49:49 compute-server grandpa[572062]: (APIServer pid=53) INFO 08-04 02:49:49 [loggers.py:314] Engine 000: Avg prompt throughput: 5790.1 tokens/s, Avg generation throughput: 115.7 tokens/s, Running: 1 reqs, Waiting: 0 reqs, GPU KV cache usage: 4.2%, Prefix cache hit rate: 95.9%, External prefix cache hit rate: 3.7%
Peak GPU KV usage was 79.4%. A simple conversion of 285,336 slots puts that at approximately 226K token slots. Because this runtime gauge includes multiple requests, shared prefixes, and block allocation, it does not represent the length of one prompt.
Prefix Cache
The prefix-cache hit rate reached 97.4%, while the external prefix-cache hit rate reached 11.4%.
  Aug 04 02:49:29 compute-server grandpa[572062]: (APIServer pid=53) INFO 08-04 02:49:29 [loggers.py:314] Engine 000: Avg prompt throughput: 293.2 tokens/s, Avg generation throughput: 136.6 tokens/s, Running: 0 reqs, Waiting: 0 reqs, GPU KV cache usage: 0.0%, Prefix cache hit rate: 97.4%, External prefix cache hit rate: 6.7%
Aug 04 02:50:39 compute-server grandpa[572062]: (APIServer pid=53) INFO 08-04 02:50:39 [loggers.py:314] Engine 000: Avg prompt throughput: 250.6 tokens/s, Avg generation throughput: 166.5 tokens/s, Running: 1 reqs, Waiting: 0 reqs, GPU KV cache usage: 2.1%, Prefix cache hit rate: 95.5%, External prefix cache hit rate: 11.4%
External prefix cache and native CPU KV offload are not the same thing. In the Gilded Gnosis r24 runbook, native offload is the qualified host-cache path, while LMCache remains experimental for DS4.
Coding-Agent Workload
The client did not send requests directly to vLLM. It went through Familiar, my agent-loop runtime, which applies tool-call correction and telemetry.
A representative request contained 44 messages, 10 tools, 41,230 prompt tokens, and 800 completion tokens.
  {"time":"2026-08-04T11:49:58.642929+09:00","level":"INFO","msg":"backend POST","url":"http://compute.home.arpa:8000/v1/chat/completions","model":"grandpa","stream":true,"req_stream_arg":true,"payload_bytes":180640,"total_content_chars":136124,"n_messages":44,"tools":10,"max_tokens":32768,"max_completion_tokens":32768,"reasoning_format":null,"reasoning_effort":null,"temperature":0.7}
{"time":"2026-08-04T11:50:02.952783+09:00","level":"INFO","msg":"http request","method":"POST","path":"/v1/chat/completions","status":200,"duration":4317612500,"model":"familiar","message_count":44,"prompt_tokens":41230,"completion_tokens":800}
The captured vLLM access log contained 101 HTTP 200 responses. Over the same range, it contained zero non-200 responses, CUDA OOMs, fatal CUDA errors, or tracebacks.
  Aug 04 02:50:28 compute-server grandpa[572062]: (APIServer pid=53) INFO:     10.10.10.2:52922 - "POST /v1/chat/completions HTTP/1.1" 200 OK
Aug 04 02:50:30 compute-server grandpa[572062]: (APIServer pid=53) INFO:     10.10.10.2:52922 - "POST /v1/chat/completions HTTP/1.1" 200 OK
Aug 04 02:50:34 compute-server grandpa[572062]: (APIServer pid=53) INFO:     10.10.10.2:52922 - "POST /v1/chat/completions HTTP/1.1" 200 OK
Aug 04 02:50:36 compute-server grandpa[572062]: (APIServer pid=53) INFO:     10.10.10.2:52922 - "POST /v1/chat/completions HTTP/1.1" 200 OK
Aug 04 02:50:38 compute-server grandpa[572062]: (APIServer pid=53) INFO:     10.10.10.2:52922 - "POST /v1/chat/completions HTTP/1.1" 200 OK
As a business application development example, the model generated a Django restaurant reservation system with 25 domain models, nine public service methods, 12 API endpoints, Django Admin, and seed data. All 52 tests passed.
uv run --frozen --offline python manage.py test --verbosity 2
  Ran 52 tests in 0.419s
OK
After loading the seed data, Django Admin showed three exceptional closures for Lakeside Bistro: Private Event, Maintenance, and Holiday.
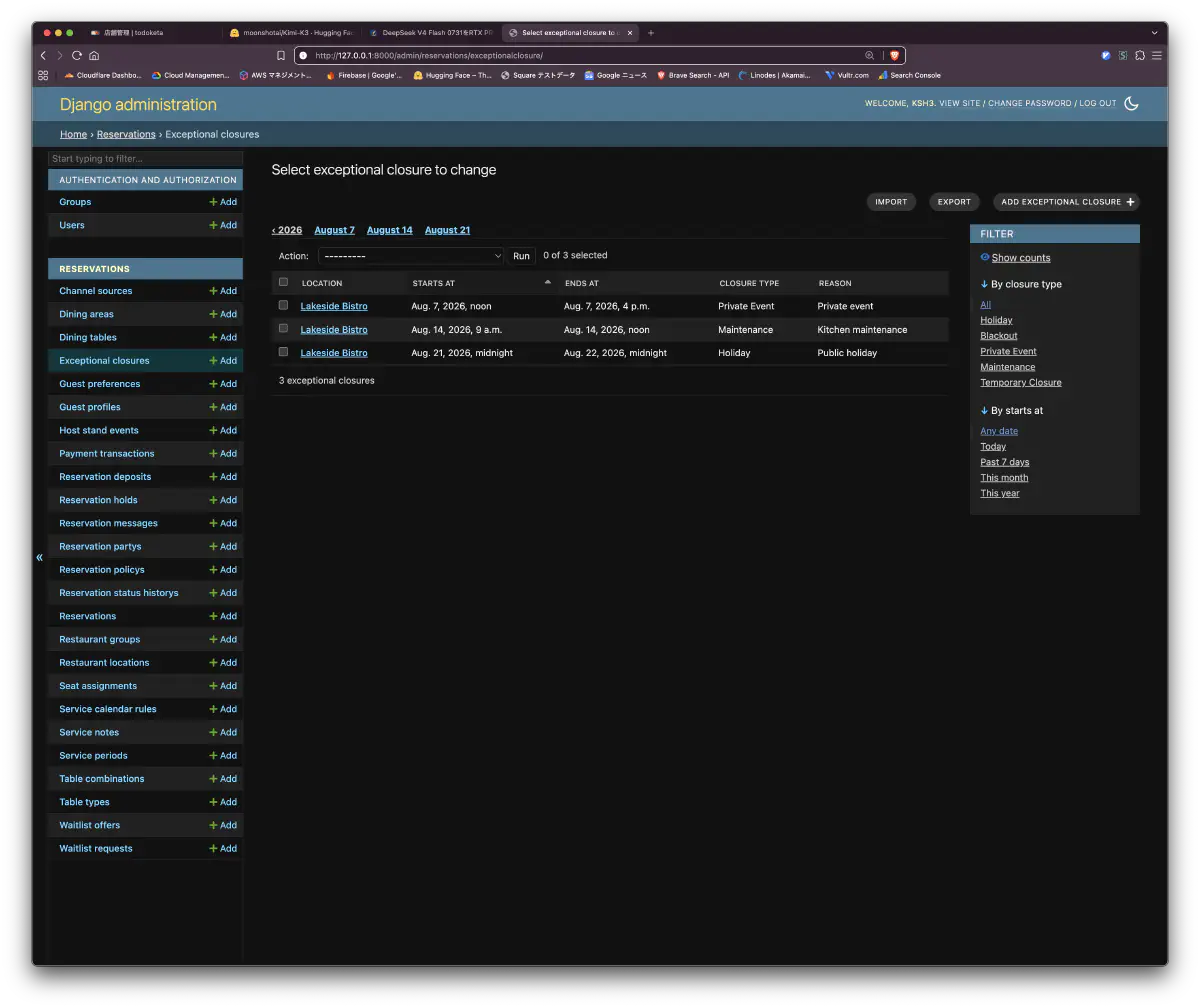
A separate review found problems in timezone-aware availability calculation, waitlist / hold expiry, and invalid foreign-key handling. The artifact remains a prototype.
Caveats
256K Capacity and 256K Correctness Are Different
What I confirmed is that the server started with a 262,144-token context setting, allocated 285,336 GPU KV tokens, and completed the mixed long-context workload without runtime instability.
CPU Offload API Is Experimental
The startup log marks the CPUOffloadingSpec API as experimental. The native offload runtime test passed in r24, but the API contract may still change.
Aug 04 02:44:21 compute-server grandpa[572062]: (Worker_TP0 pid=264) WARNING 08-04 02:44:21 [base.py:493] Initializing OffloadingSpec. This API is experimental and subject to change in the future as we iterate the design.
First-Run JIT
The first run compiles SparkInfer, TileLang, and CUDA graph artifacts. Engine initialization took 47.53 seconds in this run, including 12.64 seconds of compilation. Reusing the JIT cache volume is preferable.
Tool Calls
Familiar performs tool-call recovery and sends telemetry to Vector. I expect limited differences in editor use, but direct vLLM tool calling was not confirmed to behave identically.
The throughput and DSpark numbers themselves come from vLLM server-side metrics logs.
The next configuration to test
The terminal output looked good to me. After long use of StepFun, I plan to retune the setup around DS4.
Next I would manage 1 x 256K, 2 x 128K, or 4 x 64K in the agent loop. The active GPU working set would stay around 256K, with host RAM storing reusable prefix KV.