Running DeepSeek-V4-Flash on Two DwarfStar4 Nodes for Orchestration
A record of loading DeepSeek-V4-Flash IQ2XXS on two RTX PRO 6000 Blackwell Max-Q GPUs, one DwarfStar4 node per GPU, and evaluating it as both orchestrator and worker in a multi-agent coding system. Covers TG, worker failure, tool calls, GPU utilization, and the tool-call-as-text failure mode.

I have been evaluating local multi-agent coding systems by swapping the model used for the orchestrator role. Recently, using Step-3.7-Flash as a single model across the multi-agent setup improved things by more than one step. This time I tried a configuration where DeepSeek-V4-Flash (IQ2XXS quantization) runs as two DwarfStar4 nodes, splitting orchestration and coding work.
The short version: compared with Step-3.7-Flash and Qwen3.6-27B-EAGLE, TG31.7-35.8t/s felt rough. In the early phase of development, one shot took 10-20 minutes. Now the sessions actually finish, but even with TG100 they can take 60-70 minutes. Using that length as the baseline for multi-agent development makes the PDCA loop painful. The tooling is unstable, but the output quality still feels good in comparison. As a dedicated orchestrator it is practical enough, and I think it balances well when paired with a lightweight worker that uses speculative decoding on the coding side.
The combination of DwarfStar4/DeepSeek-V4-Flash as the ctx 44k orchestrator and Qwen3.6-27B as the ctx 144k worker is reasonably good. Recent DwarfStar commits seem to be moving toward single-model agentization, so I want to try it again after more commits land.
Evaluation Goal
My multi-agent coding system has several roles: orchestrator/planner/coder/tester/reviewer/integrator. Each role can use a different model. The orchestrator is the command role that decides what to do next on each turn and assigns work to workers.
For an orchestrator, the generated token count matters less than keeping prefix cache stable under long context, and balancing meaning and structure while rolling the ctx window without losing too much cache hit rate. Generation throughput is still useful, but it is not as dominant as it is for a worker.
Configuration
| Item | Value |
|---|---|
| Model | DeepSeek-V4-Flash-IQ2XXS-w2Q2K-AProjQ8-SExpQ8-OutQ8-chat-v2-imatrix.gguf |
| Runtime | DwarfStar4 (ds4-server) |
| GPU | NVIDIA RTX PRO 6000 Blackwell Max-Q 96GB x 2 |
| Node A | PID 5435 / GPU0 / port 8001 |
| Node B | PID 5543 / GPU1 / port 8002 |
| VRAM | 95.3 GiB / 95.6 GiB used per node |
| Host RAM | ~83.5 GB per node |
| Context | 98304 |
| Balancing | Spread across two nodes launched by the orchestration layer |
The quadlet setup starts two units that only differ by --port and GPU assignment.
  [Unit]
Description=familiar orchestrator backend (DwarfStar 4 / DeepSeek V4 Flash) node-a
After=network-online.target
Wants=network-online.target

[Container]
ContainerName=ds4-node-a
Image=registry.home.arpa/dwarfstar4:ad0209f
Pull=always
Network=host
AddDevice=nvidia.com/gpu=0
Volume=/mnt/data/models/.../snapshots/<rev>:/model:ro
Volume=/mnt/data/models/.../kv_cache:/kv
Exec=-m /model/DeepSeek-V4-Flash-IQ2XXS-w2Q2K-AProjQ8-SExpQ8-OutQ8-chat-v2-imatrix.gguf \
  --ctx 98304 --host 0.0.0.0 --port 8001 \
  --warm-weights --kv-disk-dir /kv/node-a --kv-disk-space-mb 4096 \
  --trace /kv/trace.node-a.log

[Service]
TimeoutStartSec=900
TimeoutStopSec=30
Restart=on-failure
RestartSec=30
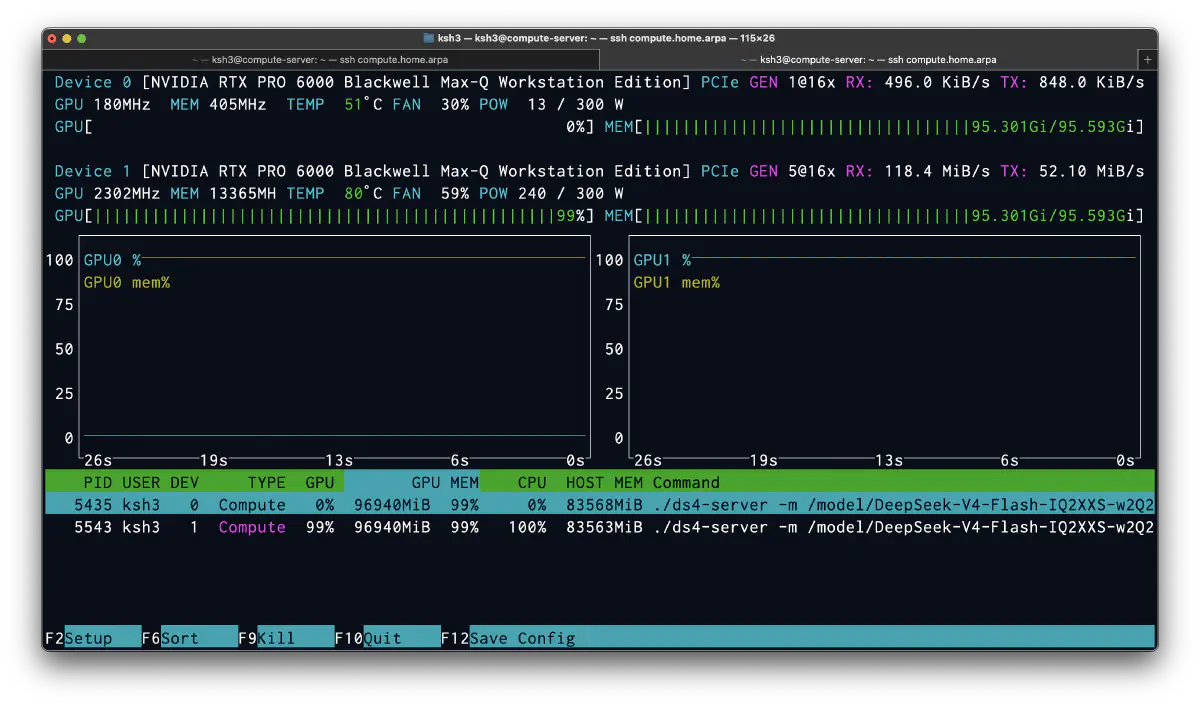
In nvtop, the two processes were pinned to separate GPUs, with each node using close to 96GB of VRAM.
Measurements
Generation Throughput
decode stayed mostly in the 31.7-35.8t/s range. During the THINKING phase after tool responses, it held around 35.7t/s. Even on longer replanning paths, it stayed near 35.7t/s. prefill was roughly 227-241t/s.
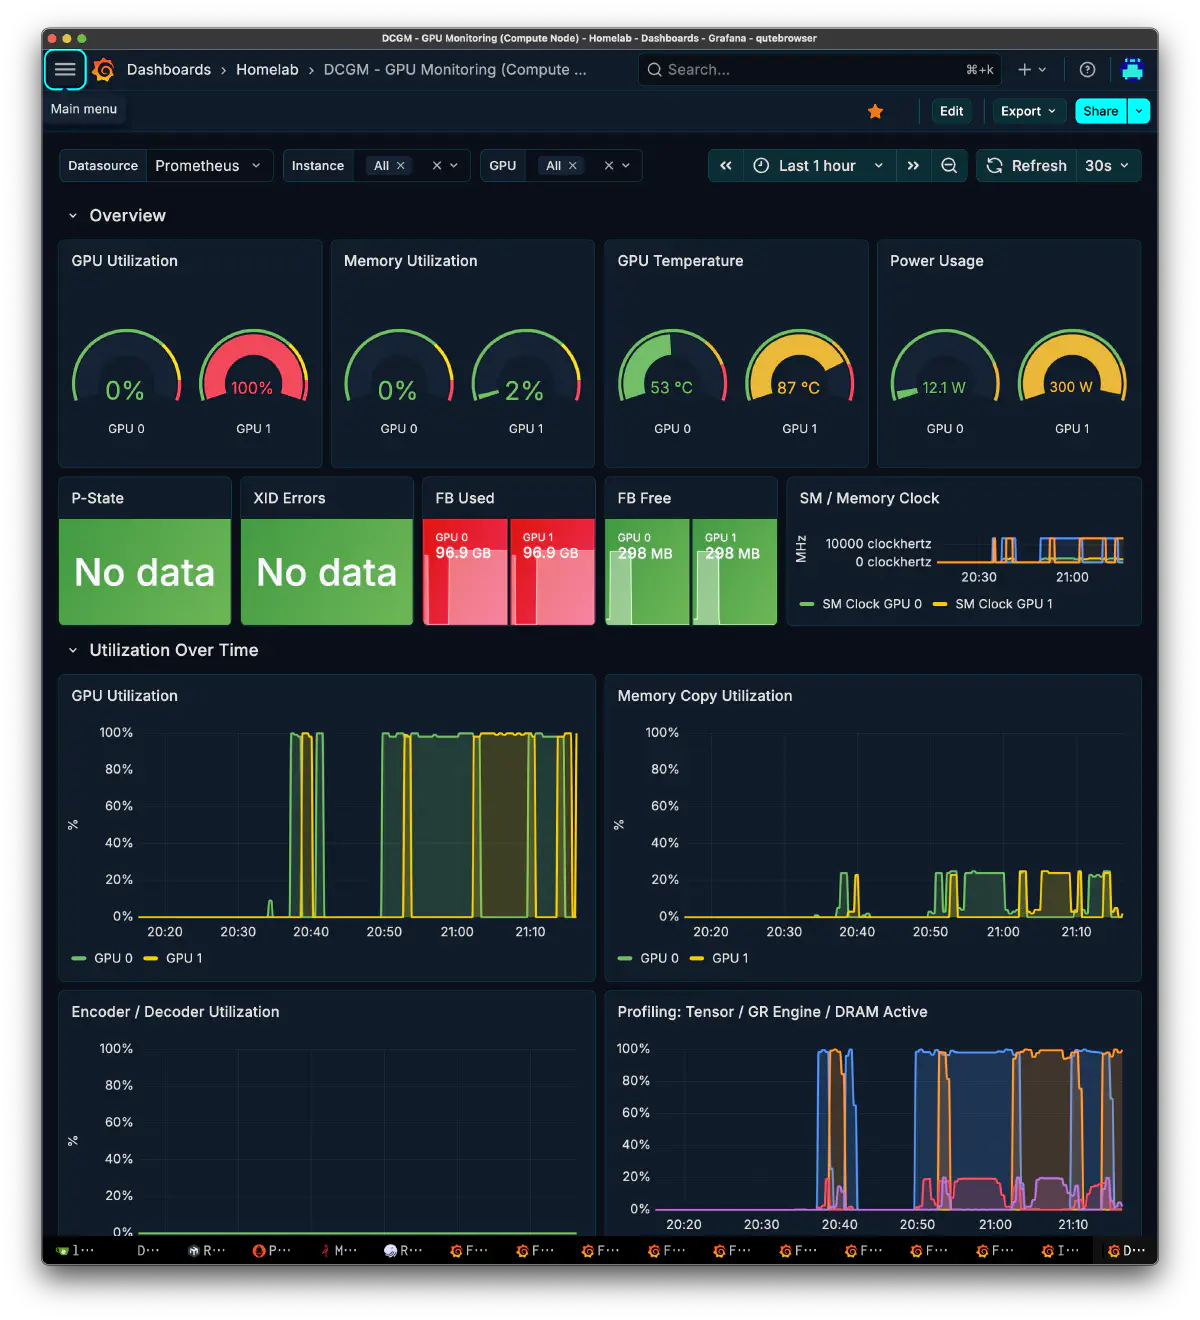
Looking at GPU utilization, the snapshot had only GPU1 decoding at 2302MHz/240W/99%, while GPU0 was idle at 180MHz/13W. Even with a two-node setup, it is normal for only one side to run during a given turn. Orchestration has strong sequential dependencies, so within a turn it tends to lean on one node. The benefit of two nodes appears when there are parallel turns or parallel workers. It has also been especially hot recently, so alternating while letting one side cool down feels good for long-term durability. The Broadcom 10GbE NIC is annoying because it still produces heat even when the link is down. Recently I think I tried a Realtek 8127. That one runs cooler, which is nice, but SSH gets unstable when the link is saturated.
Putting this TG on a single worker, meaning a role that writes long implementation output, makes the wait per request immediately noticeable. It is hard to use as a worker.
Orchestration Result
The result for one session across three turns:
| Metric | Value |
|---|---|
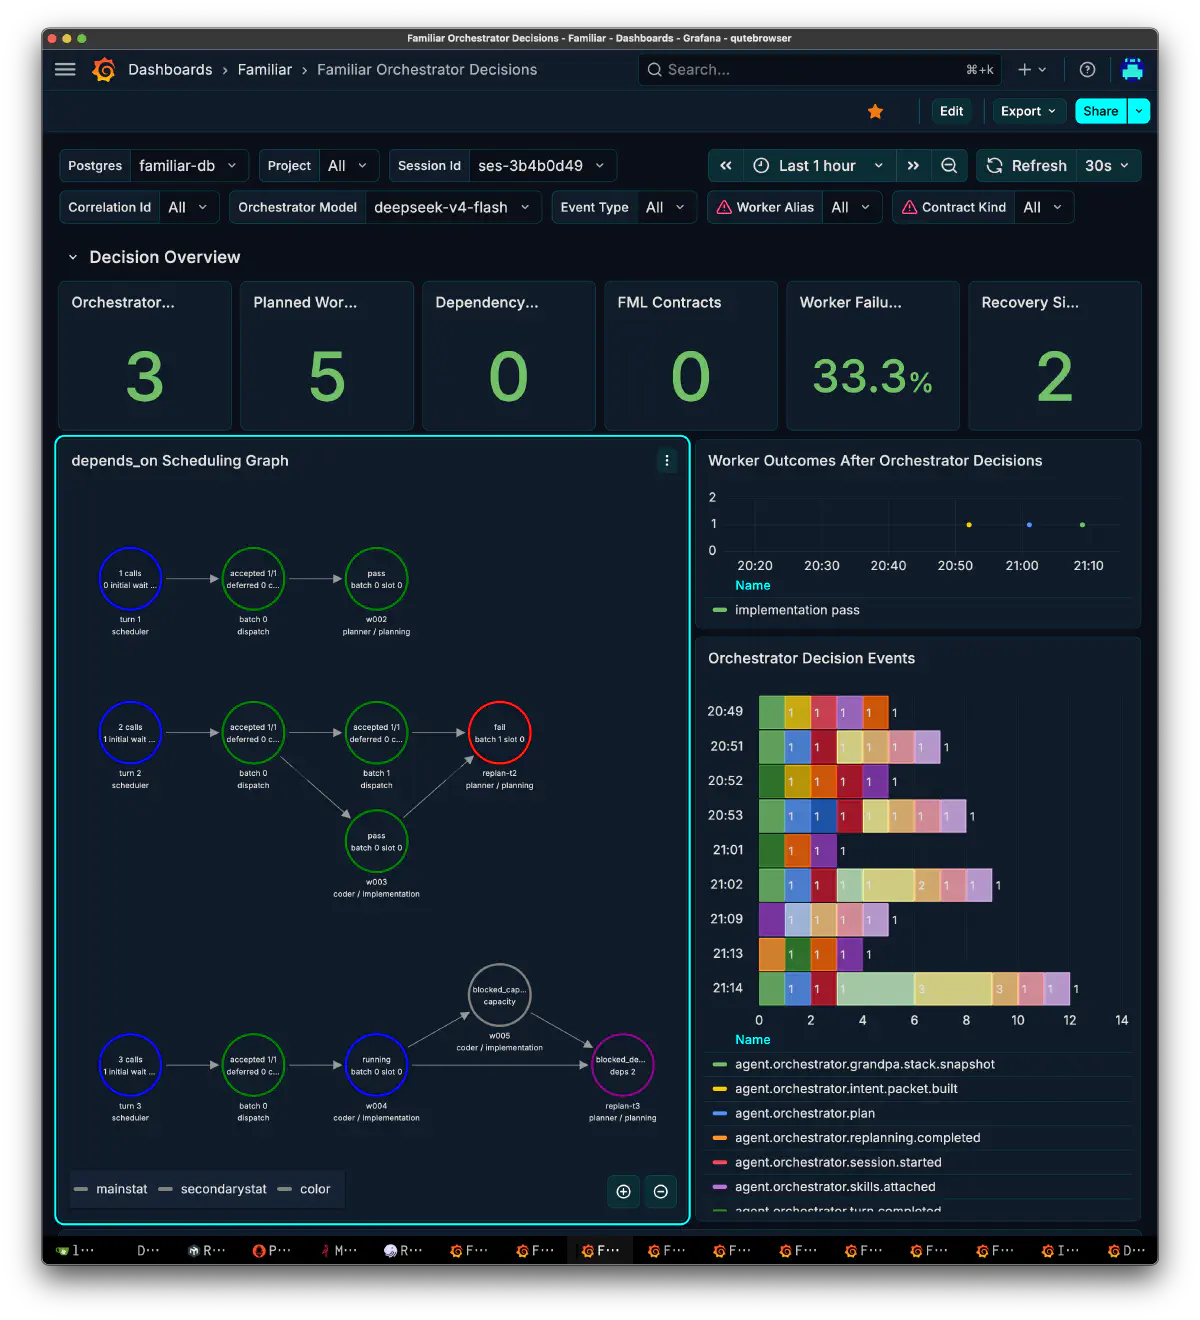
| orchestrator decisions | 3 |
| planned worker | 5 |
| dependency block | 0 |
| worker failure rate | 33.3% |
| recovery | 2 |
Across three turns, the orchestrator planned five workers. One worker failed, and replanning ran twice. replan-t2 was judged as a failure, while replan-t3 was blocked by capacity and dependency state. The DAG construction, dependency resolution, and replanning loop did not collapse, which is the good part.
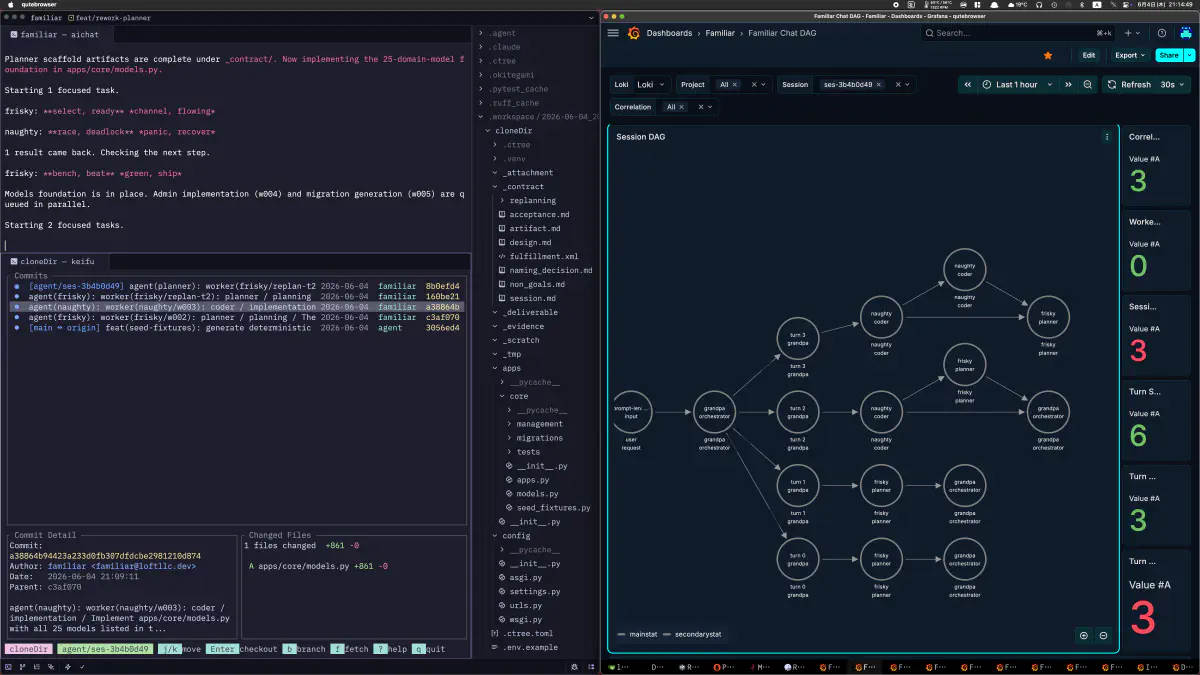
In the Chat DAG, the user request branches through the orchestrator into planner/coder on each turn, then returns results back to the orchestrator.
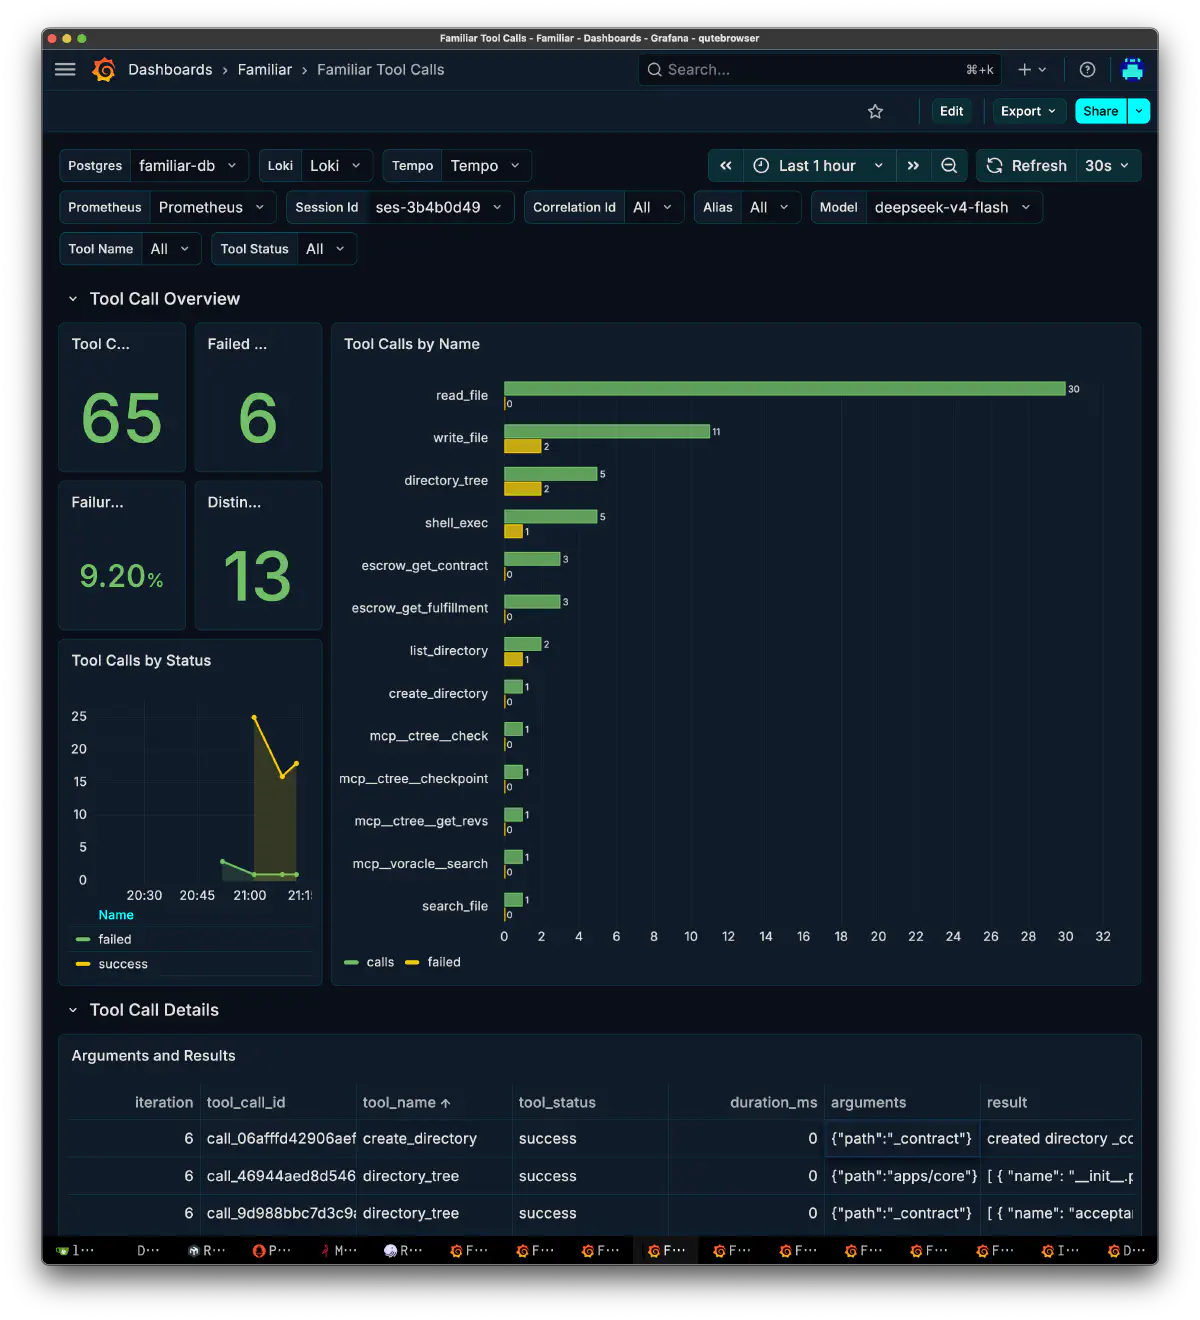
Tool Calls
| Metric | Value |
|---|---|
| total tool calls | 65 |
| failed | 6 |
| failure rate | 9.20% |
| distinct tool | 13 |
read_file dominated with 30 calls, followed by write_file with 11, directory_tree with 5, and shell_exec with 5. Failures were 2 for write_file, 2 for directory_tree, 1 for shell_exec, and 1 in other tools. For a code generation task, reads were close to three times more frequent than writes.
That said, these are not all low-level tool invocation failures. They also include false positives from my own guard rules and logical failure handling. So the failure rate should be read more as a rough view of how much calling was happening.
Generated Output
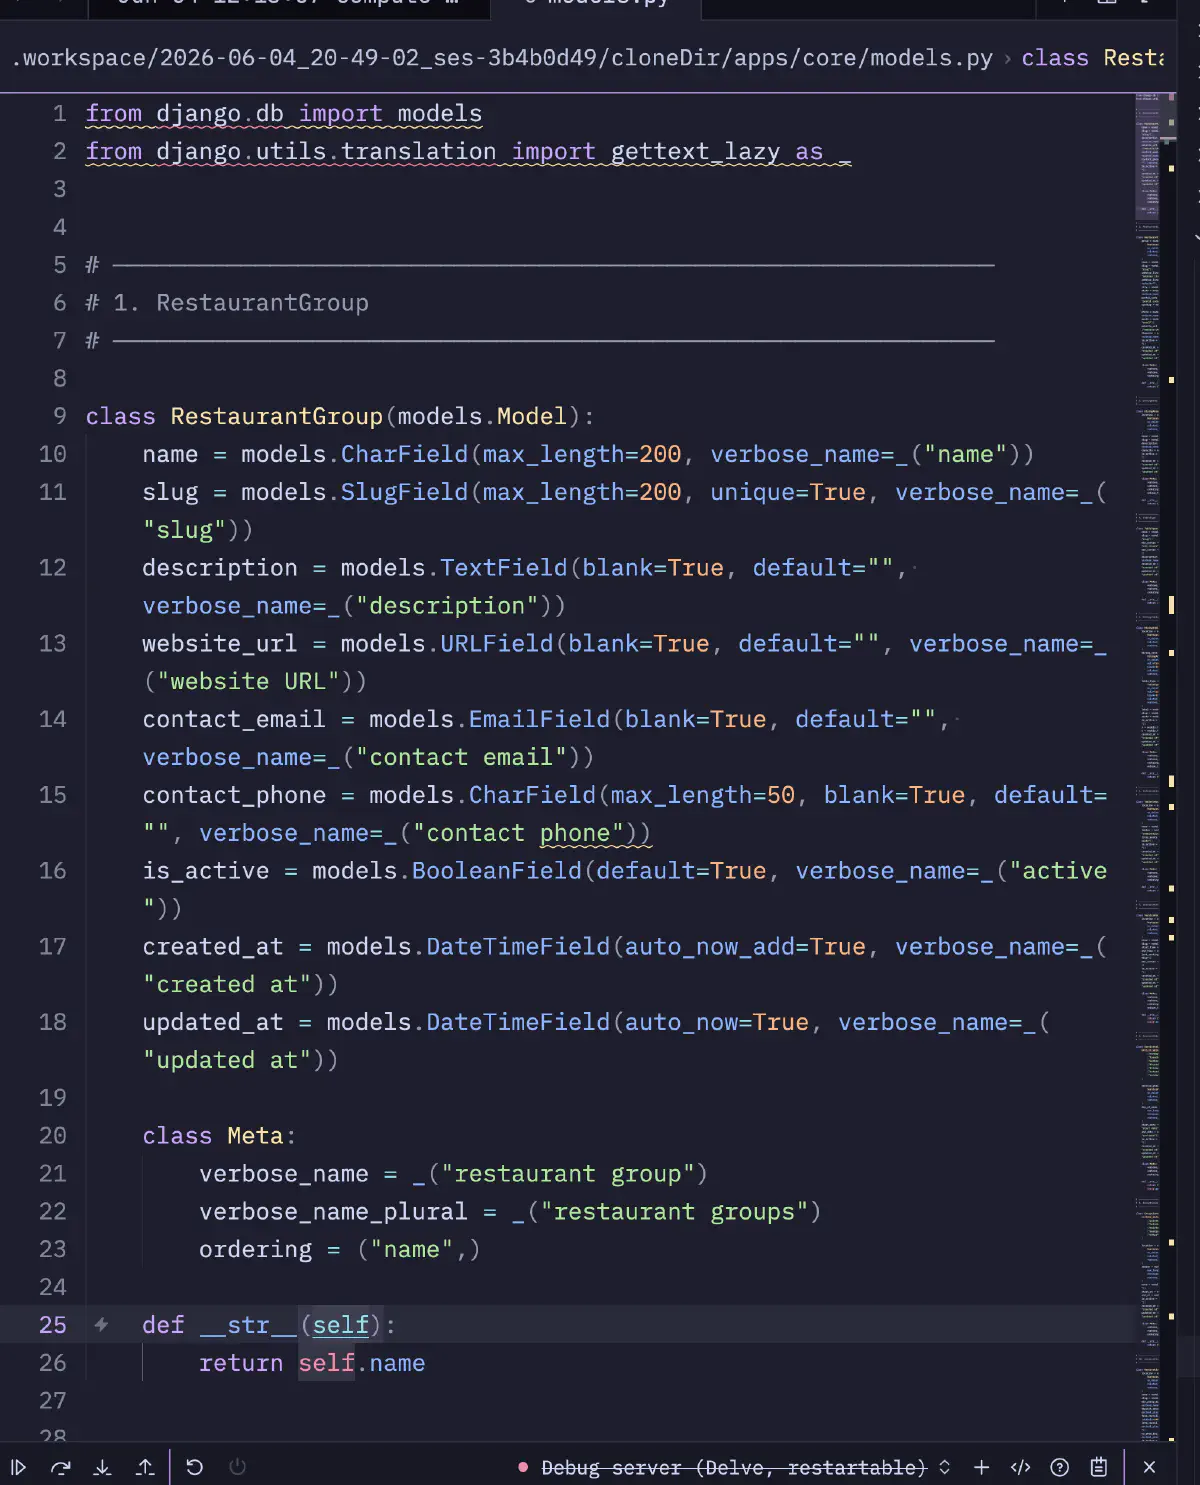
It is not enough to say that the orchestrator ran, so I also checked the code the workers generated. The task was to implement the 25-domain-model foundation for a Django app in apps/core/models.py, starting from a scaffold. It landed as commit a38864b, one file with +861 -0.
Here is the first model, RestaurantGroup.
  from django.db import models
from django.utils.translation import gettext_lazy as _


# ──────────────────────────────────────
# 1. RestaurantGroup
# ──────────────────────────────────────

class RestaurantGroup(models.Model):
    name = models.CharField(max_length=200, verbose_name=_("name"))
    slug = models.SlugField(max_length=200, unique=True, verbose_name=_("slug"))
    description = models.TextField(blank=True, default="", verbose_name=_("description"))
    website_url = models.URLField(blank=True, default="", verbose_name=_("website URL"))
    contact_email = models.EmailField(blank=True, default="", verbose_name=_("contact email"))
    contact_phone = models.CharField(max_length=50, blank=True, default="", verbose_name=_("contact phone"))
    is_active = models.BooleanField(default=True, verbose_name=_("active"))
    created_at = models.DateTimeField(auto_now_add=True, verbose_name=_("created at"))
    updated_at = models.DateTimeField(auto_now=True, verbose_name=_("updated at"))

    class Meta:
        verbose_name = _("restaurant group")
        verbose_name_plural = _("restaurant groups")
        ordering = ("name",)

    def __str__(self):
        return self.name
It covers the usual Django model basics: i18n through gettext_lazy, the combination of blank=True and default="", Meta with verbose_name/ordering, and __str__. This stayed mostly consistent across 25 models. However, Qwen3.6 can produce something close to this as well, so when the choice is TG over 100 versus TG in the 30s, the trade-off is not obvious.
Observed Failure Mode
Separate from TG, the planner in a replanning path produced this log:
  invalid tool call returned as assistant text finish=stop
  [text_len=1864 saw_start=1 saw_end=1]
What happened was this: the planner judged that the replanning path should not declare new artifacts, then tried to write a wire-protocol declaration XML inside the content argument of a write_file tool call. The harness detected the structured-output start and end markers, saw_start=1 saw_end=1, but returned it as assistant text instead of a tool call.
  <...DSML...tool_calls>
<...DSML...invoke name="write_file">
<...DSML...parameter name="content" string="true"><familiar wire=....
    <thought>Re-planning pass: ... No deviations requiring corrective scope. ...</thought>
In other words, it nested the structured document that should have been returned at the top level inside a tool argument. The parser could not confidently resolve which context it belonged to, so it fell back to text.
I think this failure comes from both sides:
- Model behavior: on replanning, it confuses the boundary between artifact declaration and tool call.
- Parser strictness: nested structured markers are treated safely as text.
I have not tested DeepSeek that much yet, so I am not sure, but Qwen-family models are especially sticky with XML. When the wire protocol uses XML, tool-call mistakes tend to increase. I also implemented and tried a TOML-based wire protocol. It reduced tool-call mistakes, but it also lost the benefit that XML is very well represented in the model’s training data. Recently I have been thinking that an HTML-based wire protocol might be surprisingly good. It appears often in model training data, so the structure should be easier for the model to understand.
Current Evaluation
TG ~34t/s is weak for a worker. It is not suited to roles that write long implementation output. DeepSeek-V4-Flash/DwarfStar4 feels more realistic as an orchestrator, where decision count is lower and output tokens are shorter, or as a source of distillation data because the license is permissive.
As a dedicated orchestrator, it is good. DAG construction, dependency resolution, and the replanning loop did not collapse, and the generated output was fine. The benefit of two-node distribution is not always visible inside a single turn; it matters when there are parallel turns or parallel workers. IQ2XXS looks aggressively quantized, but I also ran GLM-5.1 in smol-IQ2KS for a long time. Rather than the quantization simply being too aggressive, I often see more breakdowns around Q4/Q5 for models below 100B. It still depends on calibration and PPL.
Tool extraction reliability remains a risk. The tool-call-as-text fallback during replanning remains a parser x model-behavior issue independent of TG. Like Qwen-family models, it may get pulled too strongly toward XML.
Right now Step-3.7-Flash still feels stronger. I retried DwarfStar4/DeepSeek-V4-Flash on a recent commit, but for the current familiar orchestrator, Step-3.7-Flash felt better.