
Running DeepSeek Harness locally
DeepSeek-V4-Flash-Vision-Exp and V4.1-Flash ran on two RTX PRO 6000 Max-Q GPUs. This LLM integration example covers familiar-daemon, agent-gateway, ancestor and Django implementation logs.
Architecture change
I replaced familiar’s own agent with DeepSeek Harness.
I removed the agent from the gateway/agent/infrastructure monolith and placed DeepSeek Harness (dsh) in a container Pod with full access inside that Pod.
I split familiar into two parts, familiar-daemon and agent-gateway. ancestor, which manages the inference backend, already existed, so I kept using it as is. These three run dsh inside a Pod.
The migration took about a week after Codex Astra’s release and also served as a performance check.
The previous article covers the initial design. This article covers the replacement and its execution records.
Videos
I recorded videos of dsh running with full access inside a Pod, with inference served by vLLM on the compute host.
The first one runs deepseek-ai/DeepSeek-V4-Flash-Vision-Exp from the official checkpoint as is and has it implement a Django domain layer. The settings and numbers are in “The Vision-Exp run” later in this article.
Video link: https://www.youtube.com/watch?v=KD-4jm46izk
The second one was recorded separately with the recently released DeepSeek-V4.1-Flash in EXL3 2.0bpw. The model is the quantized model published by diffbot.
Video link: https://www.youtube.com/watch?v=CBkIkCtIxJI
Functions in the previous familiar
The previous familiar monolith included these functions:
- Compaction
- Memory
- Summarization
- Per-role memory management
- Operating the knowledge platform
- Custom tools
- MCP. Since it was written in Go, I even embedded entire MCP sources with
embed - Observability into OpenTelemetry, Vector, Prometheus, and Grafana
- What-if and replay built with Grafana and GraphQL
- A Dagster assets pipeline
- A container mechanism for verifying shell execution
- Tool recovery
Most development added tools and execution management to compensate for local LLM failures.
Why I chose dsh
I chose dsh because its plugin design allowed functions to be added separately.
At the time of writing, existing plugins sometimes covered a feature I had planned to implement.
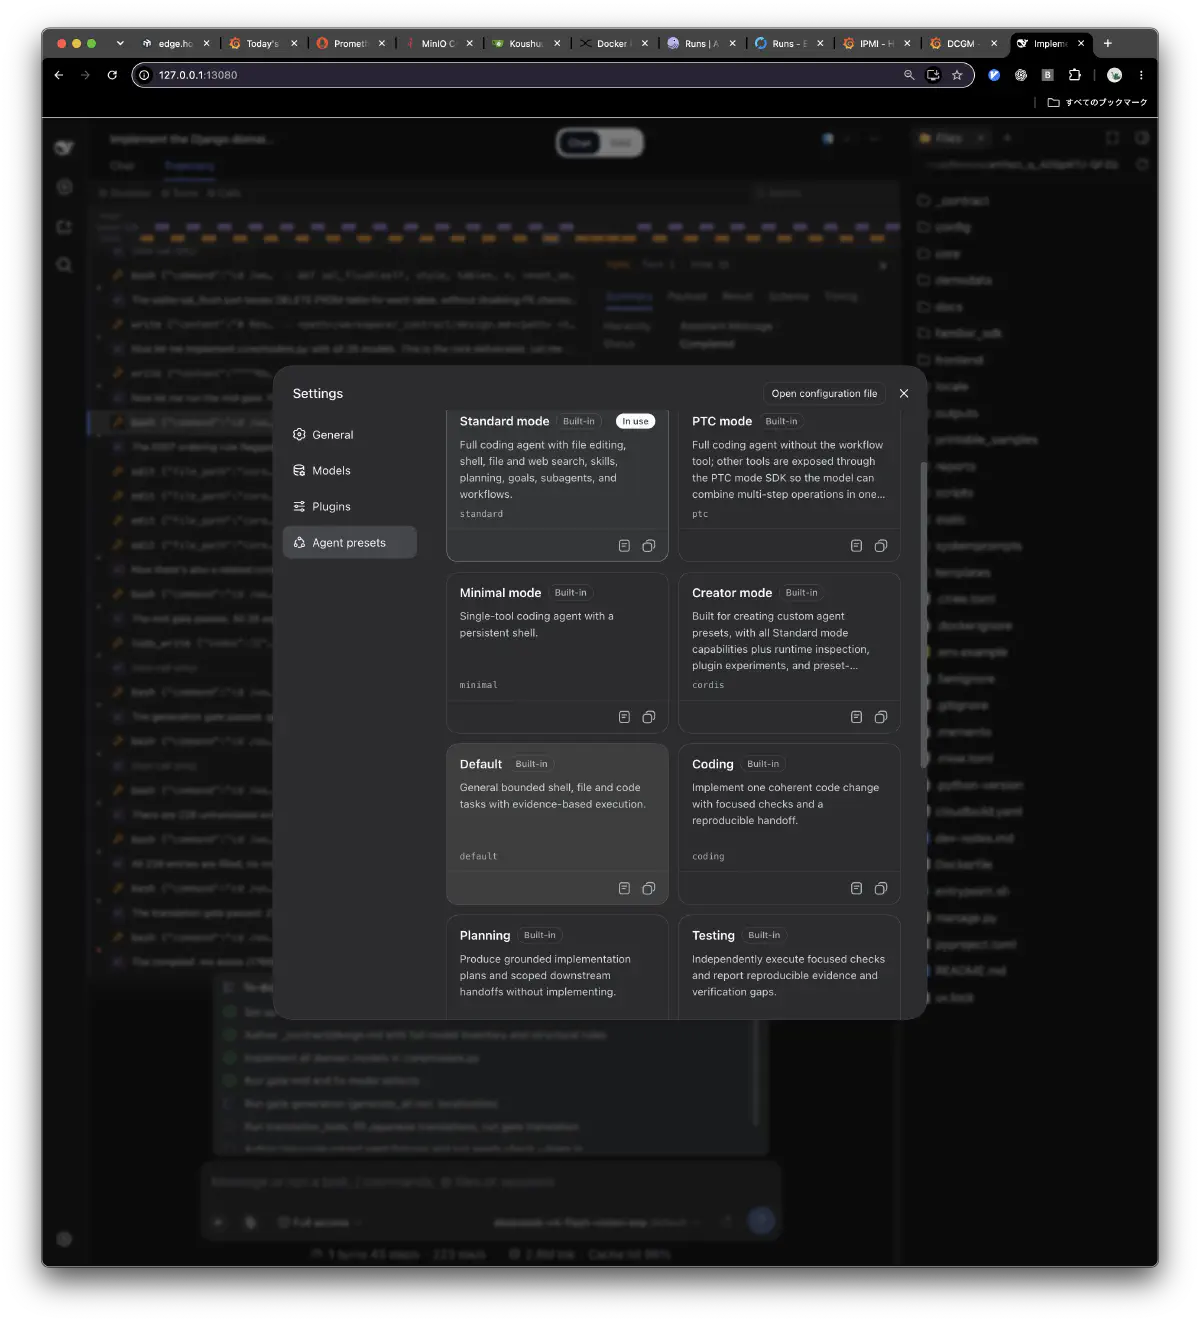
Plugins also replaced my Grafana/GraphQL what-if and replay features. ThoughtDAG displays and edits LLM context as a graph and lets runs branch. I use it in desktop dsh’s DAG tab beside Chat.
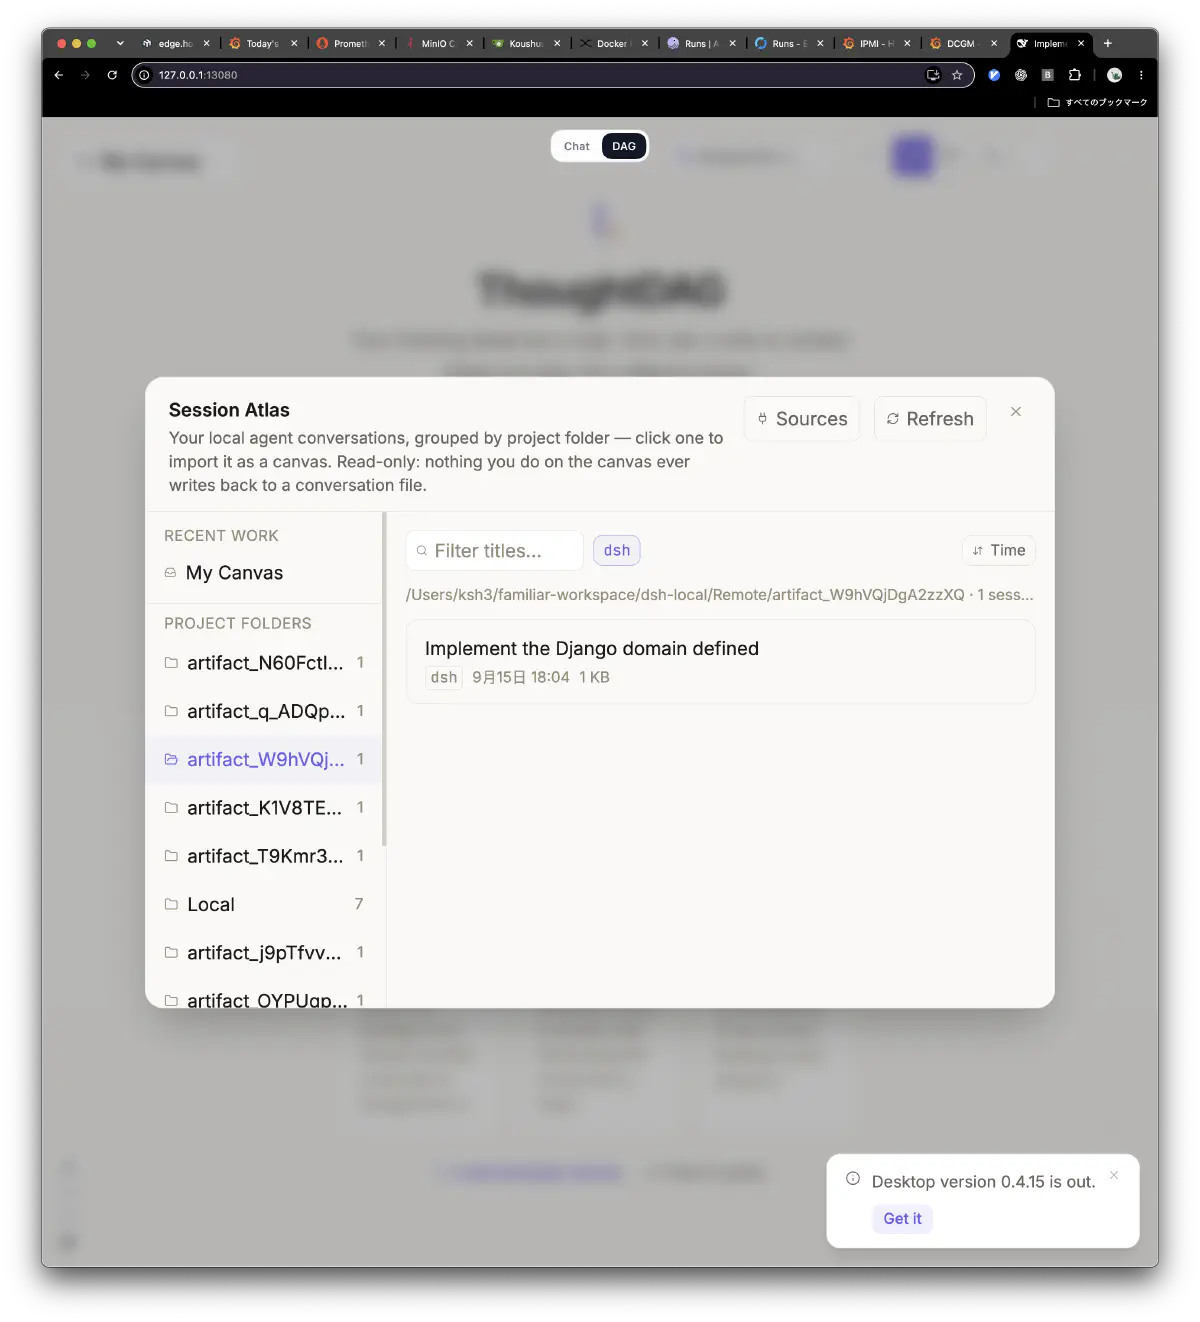
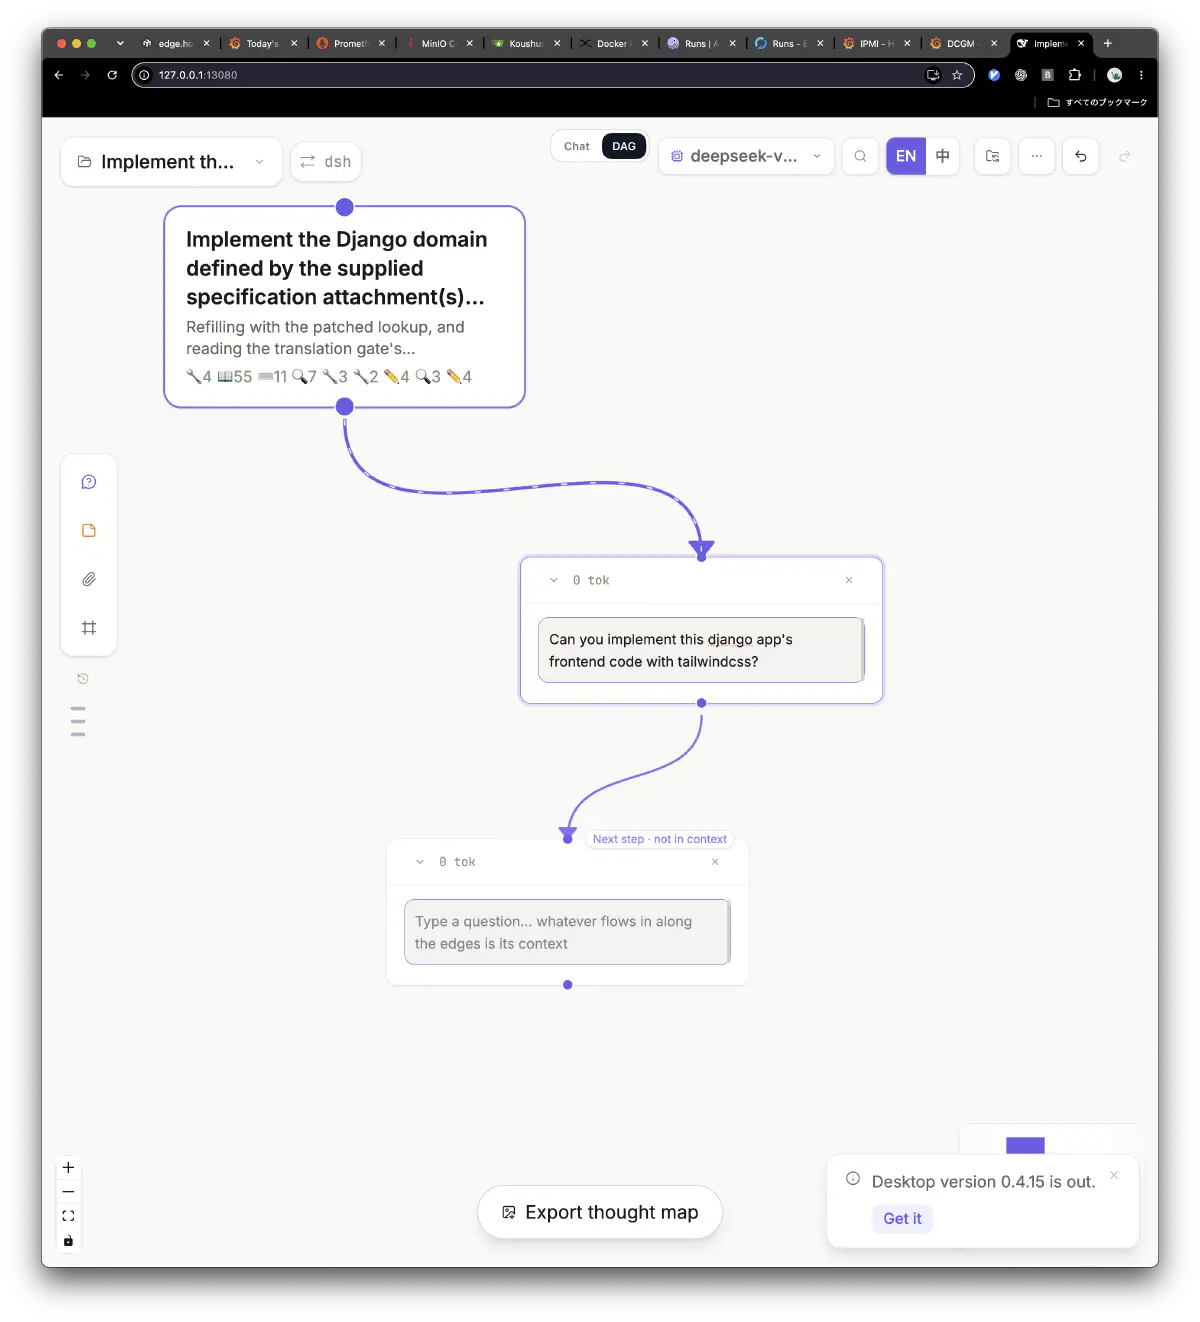
Using externally maintained plugins reduces the functions I need to build.
Three components
I retained and ported the infrastructure functions, split into these roles.
| Component | Implementation | Role | Relation to the old familiar |
|---|---|---|---|
| familiar-daemon (famd) | Go | Accepting requests (delegations) to dsh, isolated workspaces, durable state, recovery, result collection, and Pod management | Split out of familiar |
| agent-gateway | Go | Inference gateway for dsh and OpenAI-compatible clients. It discovers running Ancestor instances and routes by public model ID | Split out of familiar |
| ancestor | Rust | Manages inference servers on the compute host. It builds configurations from presets and starts or stops them with Podman Quadlet and systemd user services | Existed before; used as is |
famd owns agent execution and publishing its own operational events to NATS, and nothing beyond that. It does not own an OpenAI-compatible inference endpoint or the capture of prompts, tool calls, and responses. Those belong to agent-gateway, which publishes captures to NATS asynchronously. Observability such as OpenTelemetry was also implemented by reusing agent-gateway’s events.
Starting and stopping inference servers is ancestor’s job. Submitting a request to famd does not start or stop an inference server on its own.
Current architecture
flowchart LR
  subgraph desktop["desktop.home.arpa"]
    CLI["famdctl"]
    UI["dsh Web UI"]
  end
  subgraph compute["compute.home.arpa"]
    FAMD["familiar-daemon<br/>control / launcher / finalizer"]
    GW["agent-gateway"]
    ANC["ancestor"]
    VLLM["vLLM"]
    RELAY["famd-egress<br/>inference relay"]
    subgraph pod["runtime Pod"]
      DSH["DeepSeek Harness<br/>Full access"]
      WEB["Web relay"]
    end
  end
  NATS[("NATS")]
  CLI --> FAMD
  CLI --> GW
  CLI --> ANC
  FAMD --> pod
  ANC --> VLLM
  DSH --> RELAY --> GW --> VLLM
  GW -. discover .-> ANC
  FAMD -. events .-> NATS
  GW -. capture .-> NATS
  UI -. "SSH tunnel<br/>pod forward" .-> WEB
On compute.home.arpa, famd’s control, launcher, finalizer, and related services run as native services, and so does agent-gateway.
famd-egress is the inference entry point that Pods can see. dsh inside a Pod sends inference requests to http://famd-egress:8080/v1, and famd-egress relays them to agent-gateway. It is a Quadlet container with a read-only root filesystem and all capabilities dropped.
I submit a delegation from desktop famdctl. Acceptance creates a runtime Pod with dsh and a Web relay. dsh receives full access inside the Pod; the reasons and risks are described under “About full access.”
Using famdctl
famdctl has the following command set.
  ksh3@desktop.home.arpa ~ % famdctl
famdctl [--json] [--config path] [--idempotency-key key] <command>

  ancestor    List, inspect, plan, ensure or stop Ancestor services
  delegation  List, submit, inspect, wait for, retrieve or cancel a delegation
  session     List, start, recover, observe or close a DSH session
  events      Stream lifecycle events, resuming with --after
  artifact    Inspect or download a verified artifact
  pod         List, start, stop, remove, drain or forward runtime Pods
  dsh-local   Prepare, sync and open the local DSH Web UI
  workbench   Alias for dsh-local open
  workspace   Initialize or locate the local work records and DSH mirror
  gateway     List public models
  config      Initialize or inspect saved settings
  doctor      Check configuration; --online probes supported service APIs
  completion  Print a bash or zsh completion script

Use famdctl <command> --help for details. Output is formatted for reading.
Add --json anywhere before -- for raw JSON responses and JSONL events.
Exit status: 0 success/waiting, 1 service/local/terminal failure, 2 usage error.
Root submit/run, status, wait, result and cancel are delegation shortcuts.
Save endpoints once with config init, then use alias fam=famdctl.
ancestor operates ancestor, gateway operates agent-gateway, and delegation, session, events, artifact, and pod operate famd. Each of the three services has its own endpoint and credentials.
Here is an example of submitting the Django domain implementation task. With --detach, only the acceptance receipt comes back.
  ksh3@desktop.home.arpa ~/familiar-workspace % famdctl delegation submit --workflow django --detach /Users/ksh3/familiar-workspace/task/task.json
Work record: /Users/ksh3/familiar-workspace/workflow/django/2026-09-15/18-03-25
STATUS    DELEGATION           SESSION              ACCEPTED
accepted  del_W9hVQjDgA2zzXQ   ags_NPoXgKU5IGYmAg   2026-09-15 18:04:17
Receipt only; execution is not confirmed.
Next: famdctl delegation wait del_W9hVQjDgA2zzXQ
To see dsh inside the Pod, I open a tunnel through compute.home.arpa with pod forward and view it in a browser.
  ksh3@desktop.home.arpa ~/familiar-workspace % famdctl pod forward del_W9hVQjDgA2zzXQ
http://127.0.0.1:13080/?token=<redacted>
Pod pod_EaTd58jSdfE2kA is forwarded through compute.home.arpa; press Ctrl-C to close the tunnel.
The Web UI has Chat and Trajectory tabs, where you can see the To-dos work plan and the files in /workspace inside the Pod. Sessions that ran in a Pod are also synced to ~/familiar-workspace/dsh-local/Remote/ on the desktop and can be opened from the desktop dsh as Remote / artifact_….
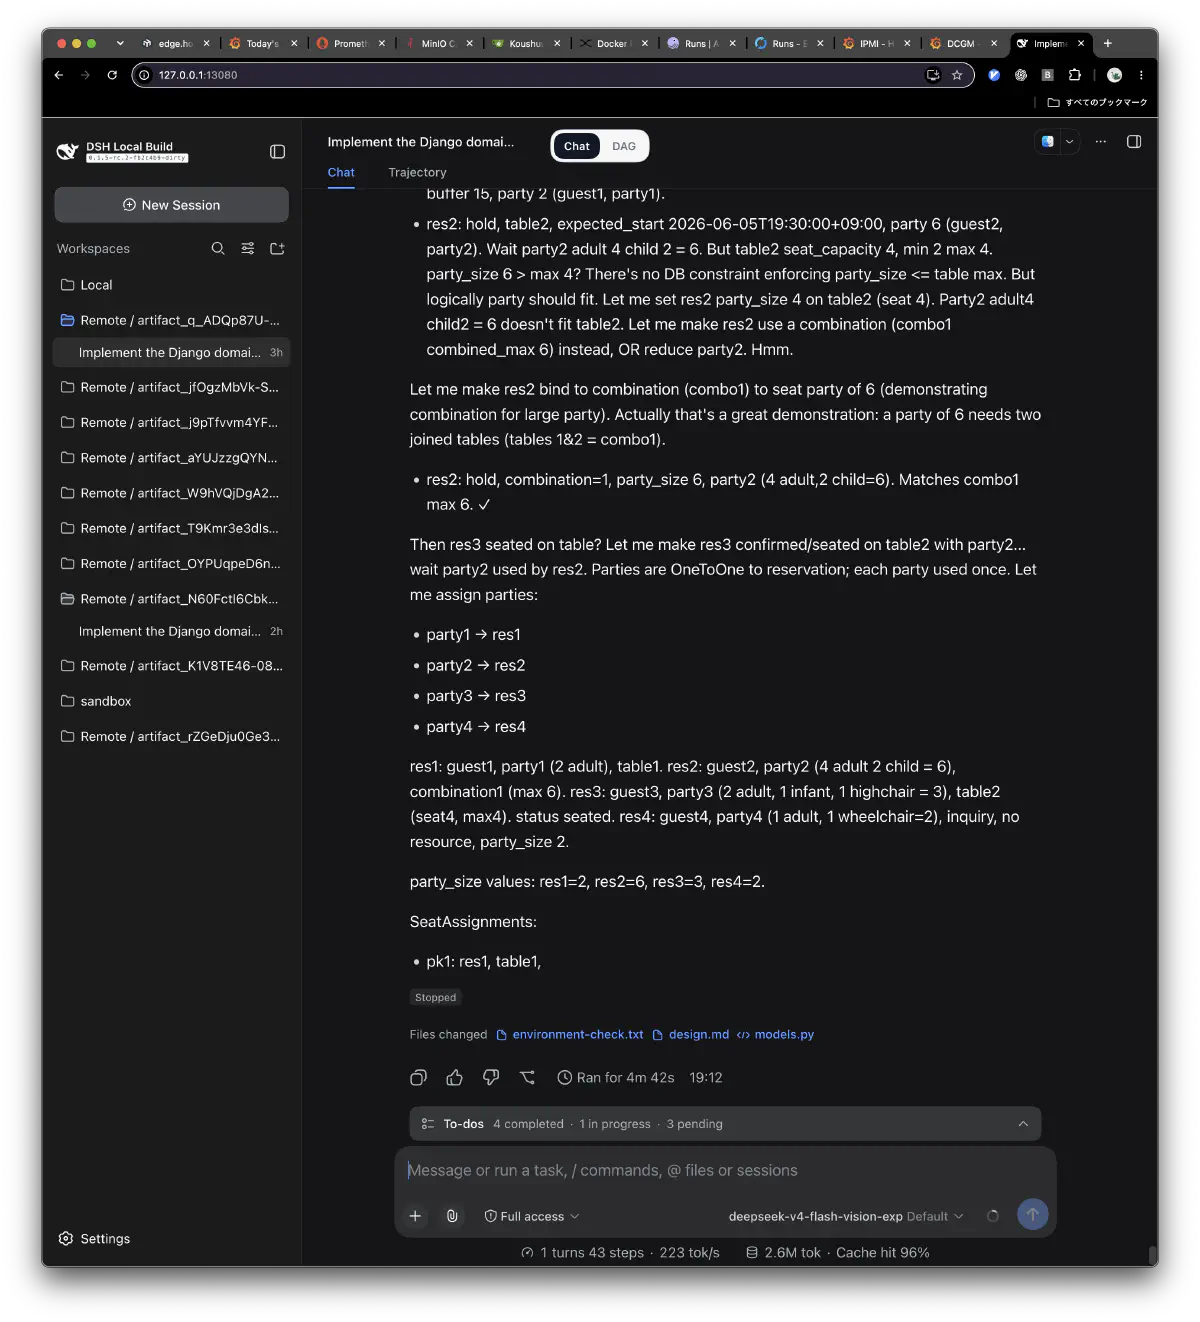
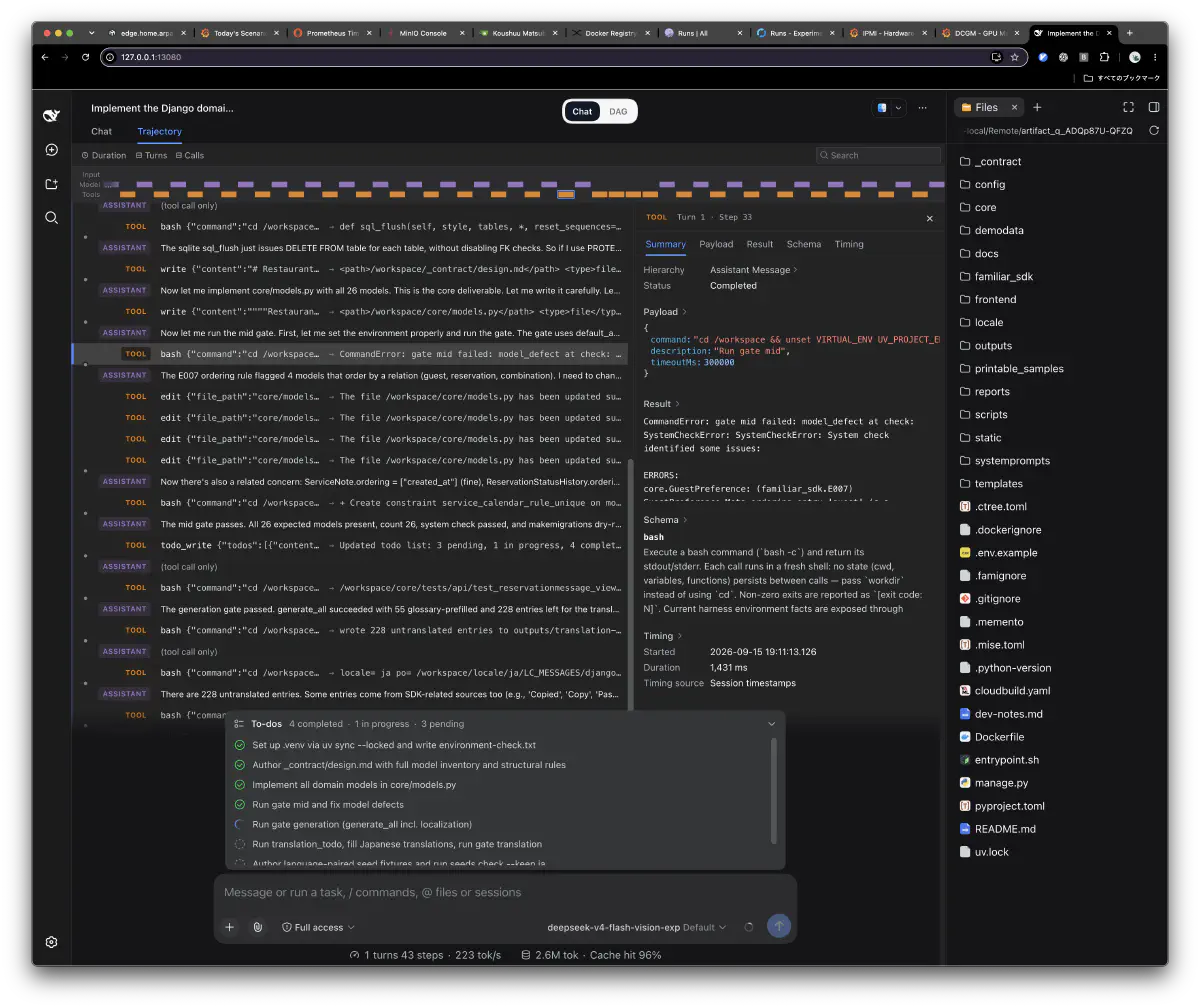
Here is podman ps on compute-server when neither vLLM nor a Pod is running.
  ksh3@compute-server:~$ podman ps
CONTAINER ID  IMAGE                                                                                                            COMMAND               CREATED         STATUS         PORTS       NAMES
77af06a3024b  registry.home.arpa/ml-foundry-mlflow@sha256:e0916a7bce42adc92f5b688e212ece81c0b1ce363e92eaf02b1118161f23cf3b     mlflow server --h...  5 hours ago     Up 5 hours                 mlflow
2144fc65532d  registry.home.arpa/ml-foundry@sha256:df3d06efff1570a47085c8002d980d66085c01c69b5d07d5afab98c4f482c888            dagster api grpc ...  5 hours ago     Up 5 hours                 dagster-user-code
381a9063ea00  registry.home.arpa/ml-foundry@sha256:df3d06efff1570a47085c8002d980d66085c01c69b5d07d5afab98c4f482c888            dagster-webserver...  5 hours ago     Up 5 hours                 dagster-webserver
9df064d0e85b  registry.home.arpa/ml-foundry@sha256:df3d06efff1570a47085c8002d980d66085c01c69b5d07d5afab98c4f482c888            dagster-daemon ru...  5 hours ago     Up 5 hours                 dagster-daemon
c9849a9fd9a5  registry.home.arpa/famd-inference-relay@sha256:702149bdc55611ef25ba40d98c0181d55e9d786507ad5b991e17ccbc96bd4ed4  --upstream http:/...  17 minutes ago  Up 17 minutes              famd-egress
famd-egress is the inference relay. famd’s control and agent-gateway are native services, so they don’t show up here.
Dagster and MLflow are ml-foundry. It is the former model-foundry, also rebuilt to fit agent-gateway, and it now has an ML pipeline for my hobby investing in addition to models.
During the Vision-Exp run, the vLLM container ancestor-deepseek-v4-flash-vision-exp started by ancestor and the Pod’s dsh runner and dsh web were also running. The two Pod containers use the same famd-dsh-runner image: --managed is dsh itself, and --proxy-only is the Web relay. The Pod publishes only one port on 127.0.0.1, and the Web UI connects to it through the tunnel.
The Vision-Exp run
In the first video, compute-host vLLM serves DeepSeek-V4-Flash-Vision-Exp, while dsh in a Podman Pod implements a Django domain layer with full access. Model requests stay on the host. This is an application-development example for local LLM integration.
Configuration
  MODEL: deepseek-ai/DeepSeek-V4-Flash-Vision-Exp @ 6821d6ad3681a4b137b066b76094fa82ebd0a380
IMAGE: registry.home.arpa/voipmonitor/vllm:ds4-jovian-r9-5bea08859798
HOST:  compute.home.arpa:8000 (engine) <- pod forward <- desktop.home.arpa (client)
POD:   dsh runner, dsh web
GPU:   NVIDIA RTX PRO 6000 Blackwell Max-Q ×2 (GPU 0,1 / 300W cap)
| Item | Setting |
|---|---|
| Context | 1M (max-model-len 1048576), max output 393,216 tokens |
| Weights | Official checkpoint as is. FP8 (e4m3, 128×128 blocks), FP4 experts, bfloat16 for the rest. No additional quantization |
| Parallelism | TP2 (tensor-parallel-size 2), no NVLink |
| Speculative decoding | DSpark fixed-probabilistic K3 (3 tokens) |
| KV cache | GPU KV only, no LMCache |
| GPU memory | gpu-memory-utilization 0.968 |
| Concurrent requests | 4 (max-num-seqs 4) |
| Batch | max-num-batched-tokens 4096 |
| Reasoning effort | high |
| Other | Tool calling enabled, vision enabled, OpenAI-compatible chat completions API |
This is the ExecStart of the vLLM service. The env file is read from ancestor’s active directory.
ExecStart=/usr/bin/podman run --name=ancestor-deepseek-v4-flash-vision-exp --cidfile=%t/%N.cid --replace --rm --cgroups=split --network=host --init --sdnotify=conmon -d --ulimit stack=67108864:67108864 --device=nvidia.com/gpu=0 --device=nvidia.com/gpu=1 -v /mnt/data/hf/hub/models--deepseek-ai--DeepSeek-V4-Flash-Vision-Exp:/models:ro -v /mnt/data/hf/jit/ds4-vision-exp-jovian-r9:/cache -v /mnt/data/hf/tmp/ds4-vision-exp-jovian-r9:/container-tmp --env-file /home/ksh3/.local/state/ancestor/active/ancestor-deepseek-v4-flash-vision-exp.env --pull never --entrypoint=/usr/local/bin/lmcache-mp-wrapper.sh --ipc=host registry.home.arpa/voipmonitor/vllm:ds4-jovian-r9-5bea08859798 /usr/local/bin/serve-ds4-flash.sh
The serving profile is based on the Vision spec of DeepSeek-V4-Flash Jovian Judgement r9 published in local-inference-lab/rtx6kpro. The only exception is gpu_memory_utilization, which I set to 0.968 instead of either documented value (0.975 for GPU KV only, 0.970 with LMCache).
The entrypoint goes through the LMCache wrapper (lmcache-mp-wrapper.sh), but LMCACHE_MODE is not set. So the host tier is not used, and this is a GPU-KV-only run.
I wrote about measuring DeepSeek V4 Flash 0731 with DSpark K5 on the same two RTX PRO 6000 GPUs in another article. The model and settings are different, so I don’t put the numbers side by side.
Engine log numbers
Across a roughly 7-minute window of the engine log, there were 70 chat completion requests.
| Metric | Value |
|---|---|
| Decode throughput (average) | 180 tok/s (peak 257.9 tok/s) |
| Prefill throughput (average during prompt-processing windows) | 444 tok/s |
| DSpark draft acceptance | 53,246 / 72,615 tokens (73.3%), mean accepted length 3.20 at depth 3 |
| Prefix cache hit rate | 87.5% → 98.0% |
| Decode-only windows (average) | 216.6 tok/s |
| Windows with prefill mixed in (average) | 156.3 tok/s |
The prefix cache hit rate rose from 87.5% to 98.0% over the window. It dipped three times along the way when new prefixes came in.
Comparing decode-only windows with windows that include prefill, chunked prefill takes roughly 28% off decode on the same engine.
The dsh status bar in the video shows 201 tok/s and a 93% cache hit. Those are the client’s own numbers, counted over a different span with a different denominator, so they are not expected to match the engine counters above.
Caveats on the numbers
All numbers are averages of 10-second windows from the engine log. I did not capture TTFT, ITL, or per-request latency. Token totals are approximations from “rate × 10 seconds”, not exact counters.
Also, the published r9 numbers were measured on 600W Workstation cards. These are 300W Max-Q cards, so the numbers are not directly comparable.
About full access
Excessive guards in the previous familiar caused repeated execution failures and reduced output quality. I changed complex shell pipelines to container-side dry-runs and removed the guards. That experience informed the full-access configuration inside this Pod.
At the time of writing, I use ds4, glm5.3-flash and qwen38-flash-next for regular work. More OSS models are usable for these tasks than around March.
That said, running without restrictions leaves every risk of destructive operations in place. If you try it, isolate the environment and take a snapshot first.
Thoughts
About six months of agent development exposed model-selection issues, runtime failures and MCP implementation needs. Alongside OSS reuse, I built custom mechanisms with AI coding.
I plan to rely more on dsh plugins and community tools to reduce custom implementation.
The migration replaces the agent while retaining the infrastructure for inference and execution management.