Running GLM-5.1 IQ3_KS Locally: CPU/GPU Hybrid Inference and Expert Layer Placement
A hands-on record of running GLM-5.1 IQ3_KS (744B MoE) on a homelab with dual RTX PRO 6000 Blackwell Max-Q (96GB×2) + 768GB RAM. Head+tail GPU placement of experts holds TG at 17–19 tok/s, and a comparison with Qwen3.5-397B-A17B leads to the tentative decision to pick Qwen3.5 as the resident orchestrator for familiar.

I put GLM-5.1 IQ3_KS (744B MoE, 320 GiB) on a homelab with dual RTX PRO 6000 Blackwell Max-Q (96GB×2) + 768GB RAM, and with a CPU/GPU hybrid configuration TG stays stable at 17–19 tok/s. This article covers the head+tail GPU placement for expert layers under ik_llama.cpp, the measured benchmark numbers, and a comparison with Qwen3.5-397B-A17B as a candidate for the resident orchestrator (grandpa) in my own agent orchestration system, familiar.
Video link: https://www.youtube.com/watch?v=1JRyuCUlFeI
Hardware
| Component | Spec |
|---|---|
| CPU | AMD EPYC 9175F (16C) |
| RAM | 768GB DDR5-6400 |
| GPU | NVIDIA RTX PRO 6000 Blackwell Max-Q 96GB × 2 |
Model
GLM-5.1 is a MoE model in Zhipu’s GLM family. In the ik_llama.cpp startup log it shows n_expert = 256 and n_expert_used = 8.
| Item | Value |
|---|---|
| Architecture | glm-dsa (MoE, 256 experts, 8 active) |
| Parameters | 753.864B |
| Quantization | IQ3_KS (3.65 BPW) |
| Model size | 320.216 GiB |
| Context | 65536 (max 202752) |
| GGUF | ubergarm/GLM-5.1-GGUF |
| Runtime | ik_llama.cpp |
Expert Layer Placement: Head-heavy + Small Tail on GPU
GLM-5.1 has 79 layers (blk.0–blk.78); blk.0–blk.2 are dense and blk.3–blk.78 are MoE layers.
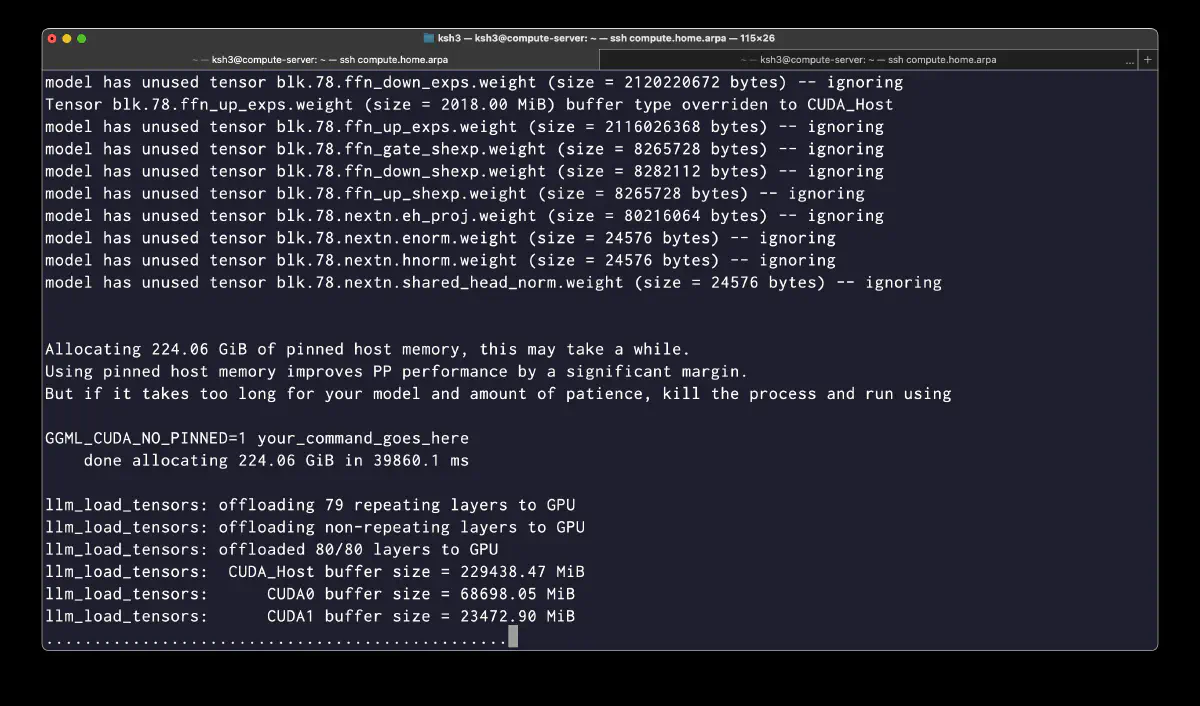
With --cpu-moe the experts default to CPU, and -ot brings individual tensors back to GPU. In this test I place the head 15 layers (blk.3–blk.17) on CUDA0, the tail 4 layers (blk.74–blk.77) on CUDA1, and leave the middle 56 layers on CUDA_Host (pinned host memory).
  OT_ARGS=""
for i in $(seq 3 17); do
  OT_ARGS="$OT_ARGS -ot blk.$i.ffn_gate_exps=CUDA0"
  OT_ARGS="$OT_ARGS -ot blk.$i.ffn_down_exps=CUDA0"
  OT_ARGS="$OT_ARGS -ot blk.$i.ffn_up_exps=CUDA0"
done
for i in $(seq 74 77); do
  OT_ARGS="$OT_ARGS -ot blk.$i.ffn_gate_exps=CUDA1"
  OT_ARGS="$OT_ARGS -ot blk.$i.ffn_down_exps=CUDA1"
  OT_ARGS="$OT_ARGS -ot blk.$i.ffn_up_exps=CUDA1"
done
Placement result (per MoE layer, experts are gate 1,225 + down 1,638 + up 1,225 = 4,088 MiB):
| Device | Role | Buffer Size |
|---|---|---|
| CUDA0 | blk.0–2 dense + blk.3–17 experts (head 15 layers) + attn/KV | 68,698 MiB (~67.1 GiB) |
| CUDA1 | blk.74–77 experts (tail 4 layers) + attn/KV | 23,473 MiB (~22.9 GiB) |
| CUDA_Host | Middle layer experts (56 layers) | 229,438 MiB (~224.1 GiB) |
GPU-side experts total 19 layers = 77,672 MiB (~75.9 GiB), and CPU pinned host holds 56 layers = 228,928 MiB of experts, which matches the log’s CUDA_Host 229,438 MiB. If all experts were kept on CPU, the theoretical size would be 76 × 4,088 = 310,688 MiB (~303.4 GiB); this run moves 76 GiB back to GPU via -ot.
Launch Command
  podman run --rm \
  --device nvidia.com/gpu=all \
  -p 8000:8000 \
  --cap-add=SYS_NICE \
  -v /mnt/data/models/models--ubergarm--GLM-5.1-GGUF:/models:ro,Z \
  registry.home.arpa/ik_llama.cpp:latest \
  -m /models/.../IQ3_KS/GLM-5.1-IQ3_KS-00001-of-00008.gguf \
  --ctx-size 65536 -ctk q8_0 -ctv q8_0 \
  --parallel 1 --threads 15 --threads-batch 24 \
  -b 8192 -ub 8192 -ngl 99 --cpu-moe \
  $OT_ARGS \
  -ger -muge -amb 512 --jinja \
  --host 0.0.0.0 --port 8000 \
  --warmup-batch --alias glm-5.1
Option flags:
--cpu-moe: default experts to CPU-ot blk.N.ffn_*_exps=CUDAX: override individual expert tensors to GPU-ger -muge: grouped expert routing + multi-GPU expert-amb 512: attention memory budget--warmup-batch: batch warmup at startup
Django App Generation
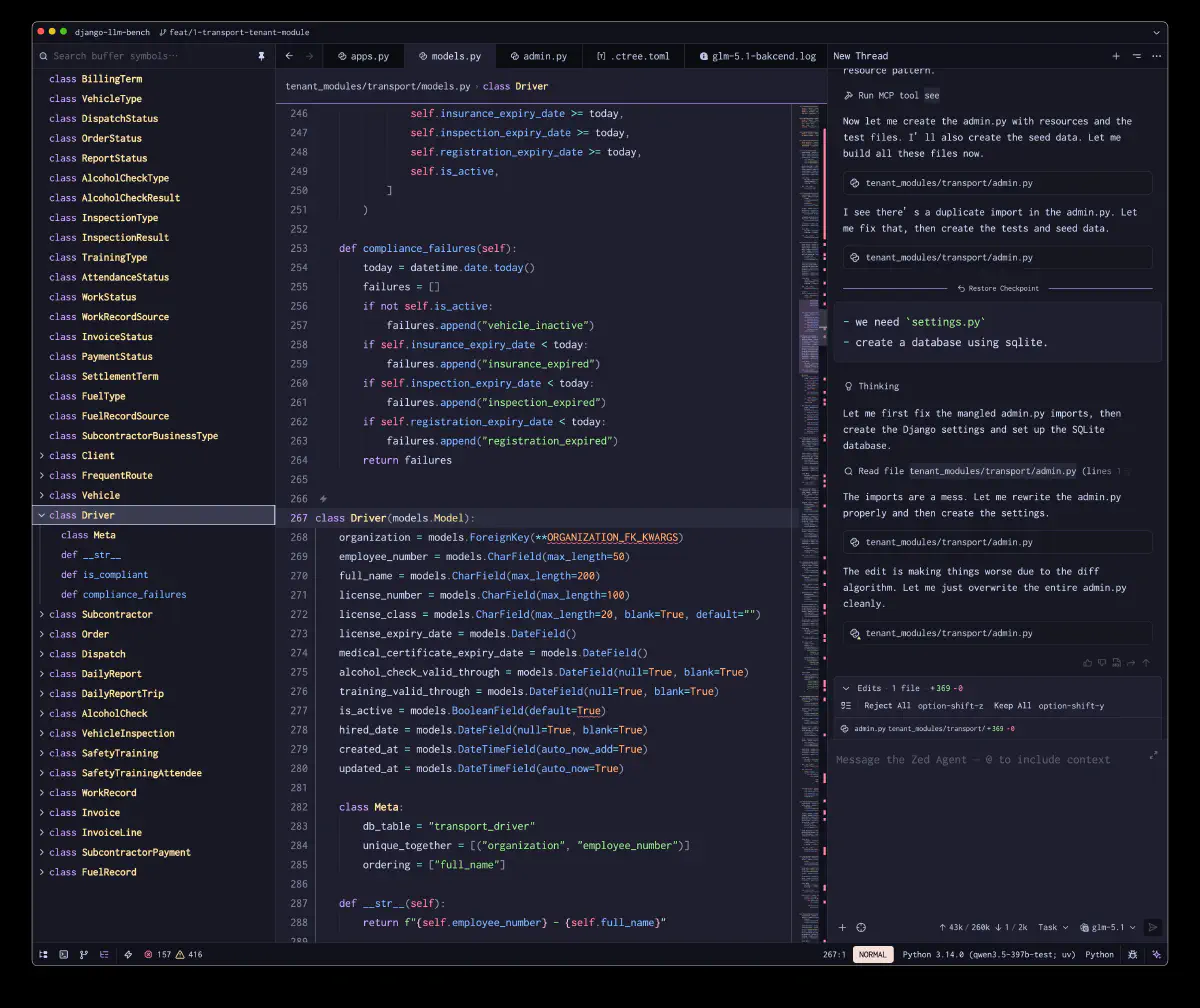
I measured on a real task: generating a logistics-industry tenant module (model definitions, admin, tests, seed data) from scratch. Driven from the Zed editor via the Zed agent.
Token Generation (TG)
| Metric | Value |
|---|---|
| Requests | 46 |
| Total generated tokens | 16,092 |
| Total prompt tokens | 131,985 |
| TG min | 16.39 tok/s |
| TG max | 19.38 tok/s |
| TG median | 17.94 tok/s |
| TG mean | 17.77 tok/s |
| ms/token range | 52–61 ms |
The largest generation was 8,884 tokens (PP 435 tok/s, TG 17.26 tok/s), producing the Django models.py code over about 8.5 minutes.
TG Stability
TG stayed stable throughout the session, but there was roughly a 2 tok/s drop between the opening and closing requests. At 53k/64k ctx this is a fairly good result.
- First 10 requests: 18.23–18.97 tok/s (avg 18.74)
- Last 10 requests: 16.39–16.86 tok/s (avg 16.69)
The KV cache growth and longer context are the likely cause. Even so, TG never dropped below 16 tok/s.
Prompt Processing (PP)
| Prompt Size | PP Range |
|---|---|
| < 100 tokens | 19–37 tok/s |
| 100–1,000 | 54–143 tok/s |
| 1,000–5,000 | 114–280 tok/s |
| 5,000–10,000 | 235–572 tok/s |
PP throughput improves with longer prompts. The initial 20,956-token input hit 571.94 tok/s. Short prompts pay relatively more overhead.
Cache Miss Problem
The log shows 26 prefix cache misses during the session, likely caused by <think> tag handling.
  Common part does not match fully
cache : ...<|assistant|><think></think>...
prompt: ...<|assistant|></think>...
The presence/position of the <think> tag shifts and the prefix breaks, which triggers re-evaluation of 7k–10k token prompts. This is the single biggest reason TTFT jumps from the 1-second range up to around 40 seconds.
| Prompt Tokens | TTFT (est.) |
|---|---|
| 23 | 1.05 s |
| 7,487 | 17.25 s |
| 9,247 | 39.28 s |
| 9,761 | 40.87 s |
GPU Metrics
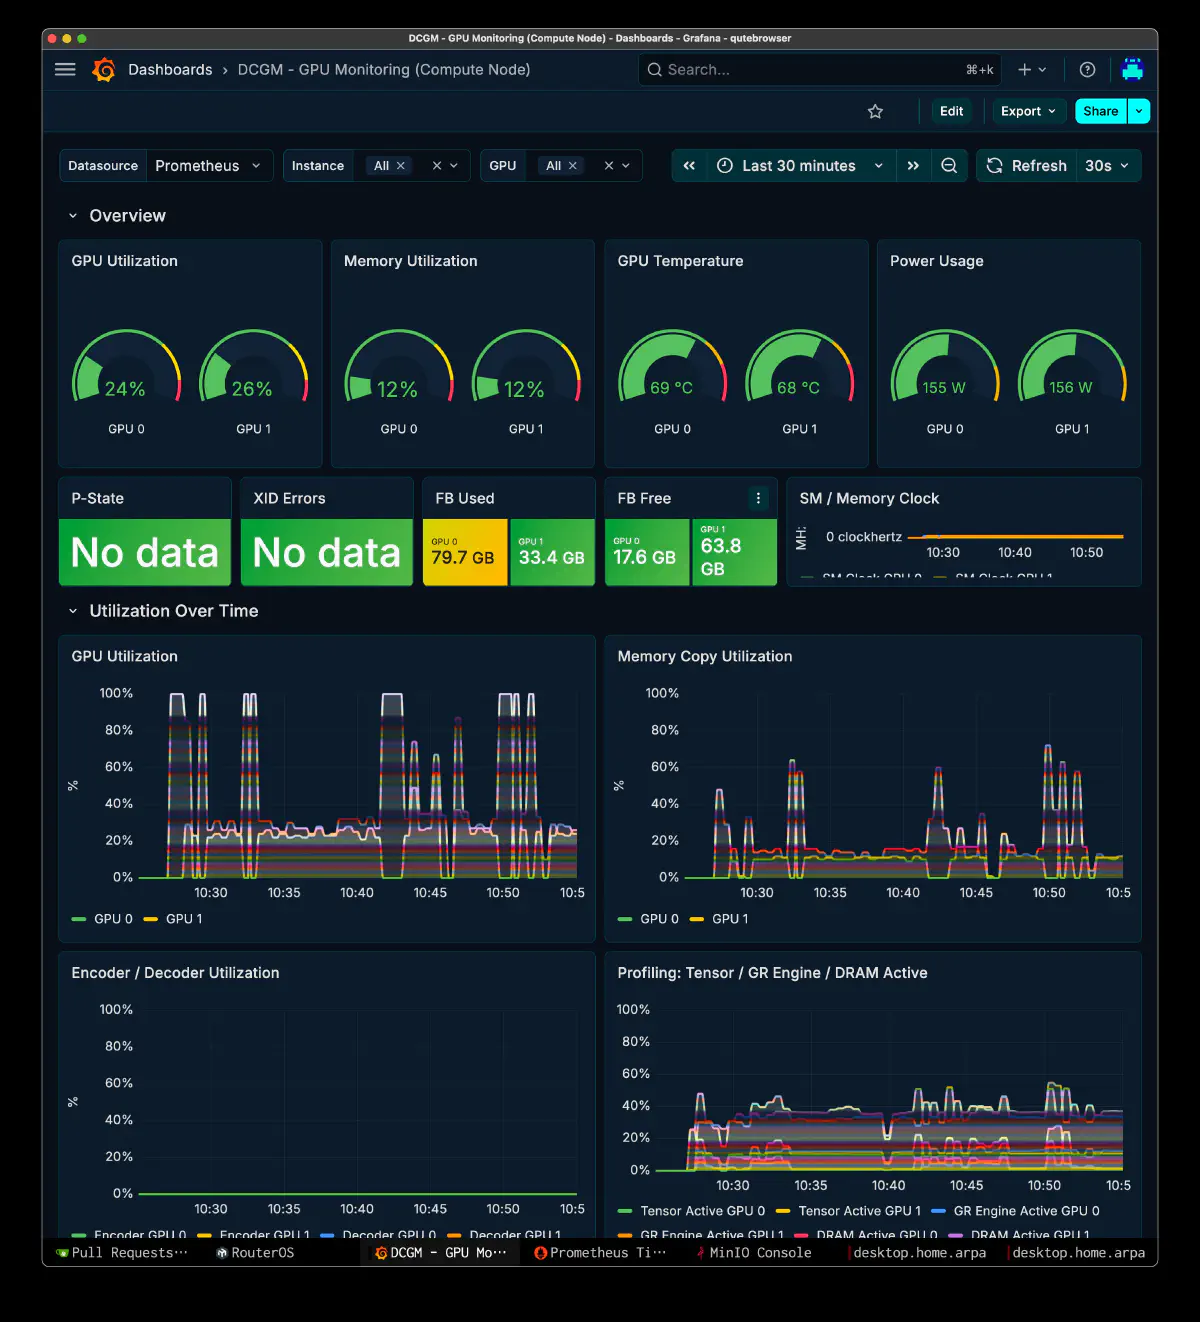
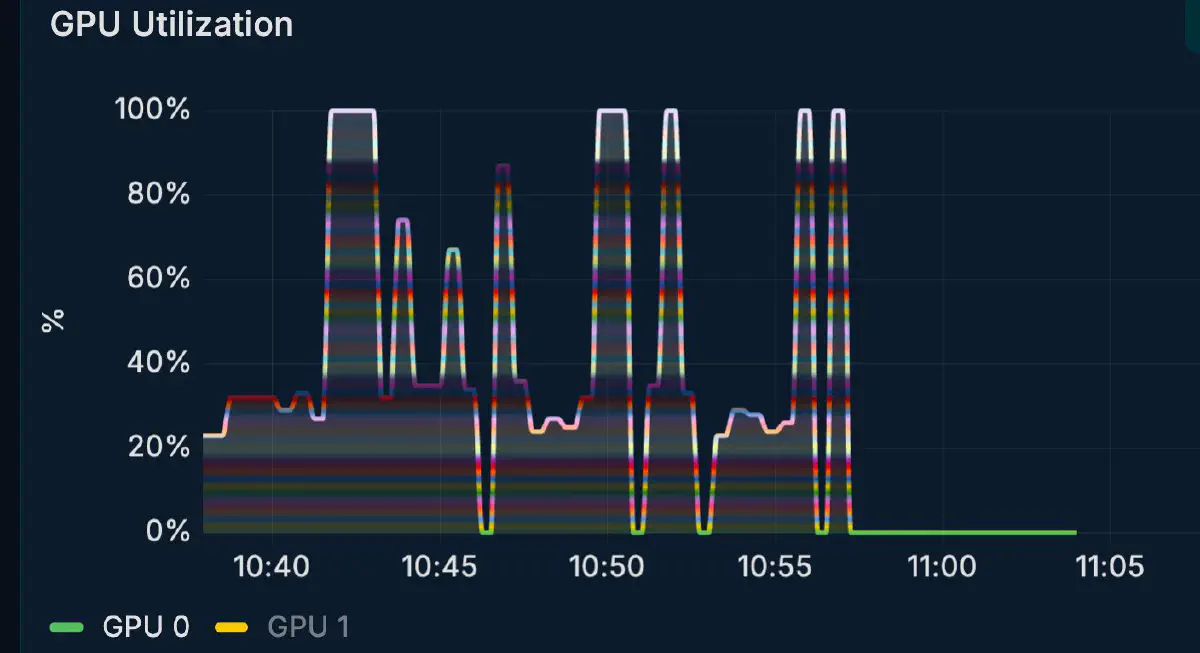
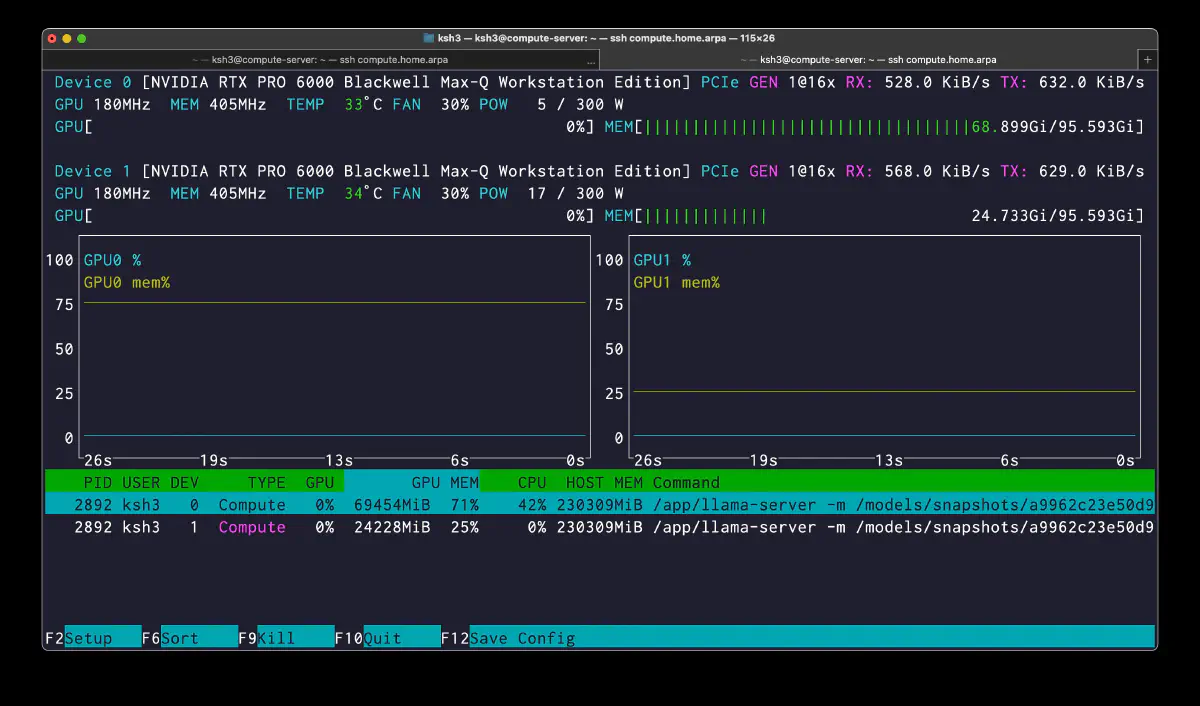
GPU utilization doesn’t pin at 100%; it oscillates per request. This is characteristic of a hybrid setup, where host-side expert reads interleave with GPU compute.
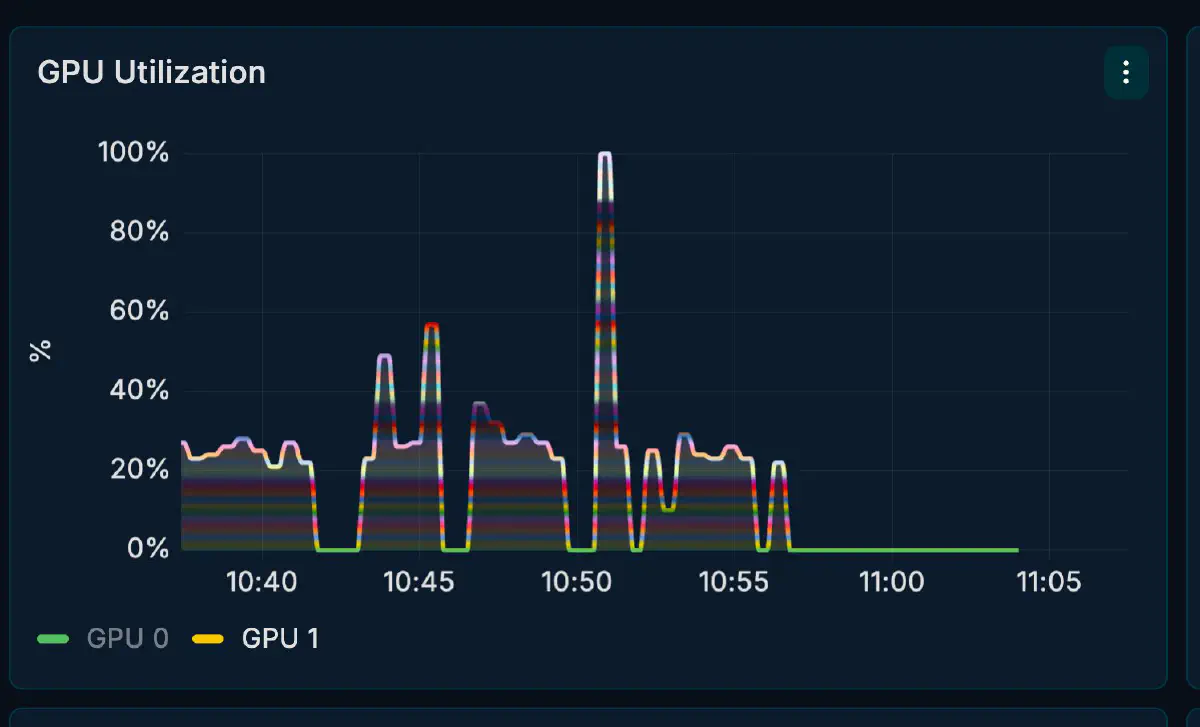
CUDA0 holds 68.7 GiB of model buffers and CUDA1 holds 23.5 GiB, so the head side (CUDA0) uses more VRAM and runs hotter. CUDA1 still has 70+ GiB of headroom, which leaves room to run a coder model or other services alongside.
CPU / Host Memory
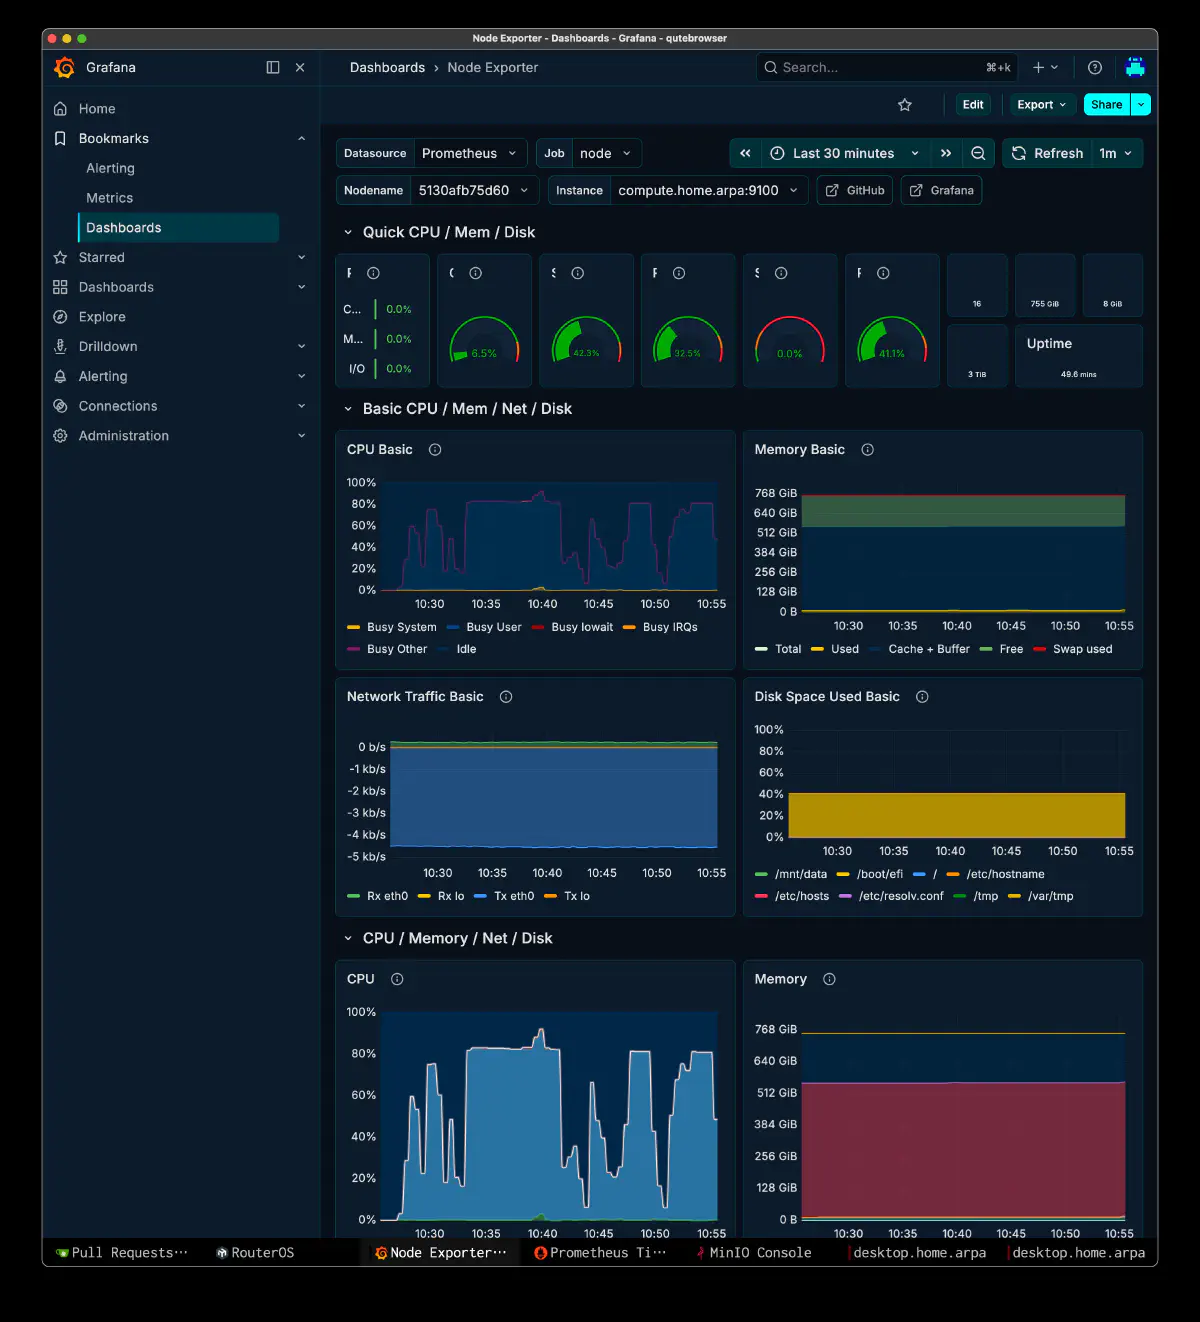
CPU isn’t the compute star here; it’s responsible for feeding host-resident expert tensors and holding the pinned memory region. High utilization reflects expert DMA transfer and runtime orchestration rather than arithmetic.
The inference environment runs on a 4-node homelab: compute.home.arpa (the GPU server) runs inference, storage.home.arpa runs PostgreSQL / Prometheus / MinIO / Dagster / MLflow, and desktop.home.arpa runs Grafana.
Orchestrator Selection: GLM-5.1 vs Qwen3.5-397B
This benchmark has a second purpose: picking a model for the resident orchestrator (grandpa) in my own agent orchestration system familiar. The two candidates are GLM-5.1 (744B-A40B) and Qwen3.5-397B-A17B.
grandpa handles task decomposition, delegation decisions to coder models, quality evaluation of generated output, and error recovery. It is expected to stay resident for long periods and coordinate two LLM backends in concert. What I want from it is task scheduling, state management, and context management — not a large ctx window or long-form generation, which can be left to the coder. In this use case GPU only needs a small slice for hot layers. Roughly a dev01:25/25 GB kind of footprint.
Spec Comparison
| GLM-5.1 | Qwen3.5-397B | |
|---|---|---|
| Total / Active params | 744B / 40B | 397B / 17B |
| Experts / Active | 256 / 8 | 512 / 10 |
| Quantization | IQ3_KS (3.65 bpw) | Q4_K_M mixed (4.93 bpw) |
| Model size | 320 GiB | 228 GiB |
| n_ctx_train | 202,752 | 262,144 |
| License | MIT | Apache-2.0 |
Test Configuration Differences
To read the comparison correctly, the two models were measured under different configurations, so I’m writing them separately.
GLM-5.1 (this run): --cpu-moe + -ot brings head 15 + tail 4 layers of experts back to GPU. GPU-side experts: 19 layers ≈ 76 GiB. CPU pinned host experts: 56 layers ≈ 224 GiB (log shows CUDA_Host 229,438 MiB). This layout was tuned for a coding bench, not dedicated to orchestrator duty.
Qwen3.5-397B (separate session): With --n-cpu-moe 15, the startup log shows blk.0–blk.14 (first 15 layers) experts landing on CUDA_Host, while the remaining 45 layers (blk.15–blk.59) of experts are on the GPU side. Qwen3.5 has a hybrid structure with full_attention_interval = 4 — the attention type switches every 4 layers — but the experts themselves are held by all 60 layers (the log’s Layer sizes shows 3,839 MiB of expert content even on the Layer 3, 7, 11... rows). Non-experts (attention, SSM, dense, output) are distributed across both GPUs via graph split, reserving 176 GiB on CUDA_Split. The measured CUDA_Host is 56,710 MiB, which matches 15 × 3,712 MiB = 55,680 MiB closely.
So GLM-5.1 is running with “most experts on CPU” while Qwen3.5 is running with “only the first 15 layers of experts on CPU”. Neither is a full-CPU configuration, and the pinned-host size swings a lot based on the setup. When evaluating both for orchestrator use, it’s worth estimating the VRAM requirement for both at expert=full-CPU separately.
VRAM Requirements at Expert=Full CPU
Taking the non-expert rows from each startup log’s Layer sizes, and adding KV cache + compute buffer:
| GLM-5.1 | Qwen3.5-397B | |
|---|---|---|
| Non-exps weight (attn+dense+output) | 6,518 MiB | 7,058 MiB |
| KV per 1k ctx (q8_0) | ~46 MiB | ~16 MiB |
| KV cache (ctx 65k, q8_0) | 2,984 MiB | ~1,040 MiB |
| KV cache (ctx 200k, q8_0, est.) | ~9,228 MiB | ~3,200 MiB |
| KV cache (ctx 262k, q8_0) | — | 4,080 MiB |
| Compute buffer | ~12 GiB | ~11 GiB |
| VRAM total (exps=CPU, ctx 65k) | ~22 GiB | ~19 GiB |
| VRAM total (exps=CPU, ctx 200k) | ~28 GiB | ~21 GiB |
| VRAM total (exps=CPU, ctx 262k) | — | ~22 GiB |
Qwen3.5’s attention is hybrid and KV efficient, fitting within 16 MiB/1k. GLM-5.1 has MLA-style attention, but with larger head count and dim, KV costs 46 MiB/1k. As a result, at ctx 200k GLM-5.1 runs about +7 GiB heavier.
CPU Pinned Host Difference
| GLM-5.1 | Qwen3.5-397B | |
|---|---|---|
| Exps per layer | 4,088 MiB | 3,712 MiB (+some 3,839 MiB) |
| Layers holding exps | 76 (blk.3–blk.78) | 60 (all layers) |
| Total exps (full-CPU, theoretical) | ~303 GiB | ~218 GiB |
| CPU pinned in this test | 229 GiB (56 layers) | 55 GiB (15 layers) |
| Pinned alloc time (test) | 40s | 9s |
Inference Performance
| GLM-5.1 | Qwen3.5-397B | |
|---|---|---|
| TG (early session) | 18–19 t/s | 55–59 t/s |
| TG (late session, ctx full) | 16–17 t/s | 17–18 t/s |
| PP max | 572 t/s | 1,500 t/s |
| Cache restore | N/A | 14–18 ms (checkpoint) |
| Cache miss | Frequent, from <think> mismatch | Stable via checkpoint restore |
The early-session TG gap is large, but in longer sessions both converge around 17–18 t/s. Orchestrator output tends to be short (delegation instructions, routing decisions), so the absolute TG number matters less than the quality of reasoning.
Qwen3.5’s PP being 3× faster helps on cache-miss recovery. GLM-5.1’s cache miss comes from <think> tag mismatch, so there may be room to resolve it by starting with thinking off.
Reasoning Quality
Looking at the infrastructure numbers alone, Qwen3.5 looks favorable: 3× PP, lighter CPU pinned, ctx 262k, stable cache. But what I want from an orchestrator is scheduling tasks to lower-level workers, managing state, and managing ctx.
GLM-5.1 is active 40B, Qwen3.5 is active 17B. Judgment tasks like task decomposition accuracy, error recovery strategy planning, and output quality evaluation tend to scale with active parameter count, and aren’t solved just by stuffing more into ctx. Going by raw reasoning power you’d want GLM-5.1, but “smart” and “survives as a resident service” are different things, and in the end the only way to know is to run it in real workloads, observe, record, and evaluate repeatedly. Honestly, my current gut feeling is that Qwen3.5 will hold up longer over time.
ctx Strategy: Lighten via RAG, or Stuff It All In
n_ctx_train is 202k for GLM-5.1 and 262k for Qwen3.5. Assuming the effective ceiling is around 70% of ctx max, GLM-5.1 has about 141k usable and Qwen3.5 about 183k. The gap is real, but both are wide enough to “put everything in”. The question is operating policy.
GLM-5.1 + RAG shaping (ctx ~64k operation):
Hand the orchestrator only what it needs, via RAG. Assuming Gitea aggregates the code and it’s indexed with ColBERT + maxsim reranker, argus (Gitea symbol DB) and voracle (Obsidian vault semantic search) keep a live index, and the orchestrator hits these MCP tools to pull just the context it needs. Capping ctx around 64k keeps KV cache at ~3 GiB, TTFT short, and TG degradation minimal.
This kind of usage would likely work on a Mac Studio too. With unified memory, the CPU/GPU boundary is thinner, and running lean with a tight ctx budget might actually be easier to manage.
Qwen3.5 + power play (ctx ~183k):
Dump conversation history, tool results, and code all into ctx. Skipping the filter step cuts the orchestrator’s decision load. Whether an active-17B model can filter that much content sensibly is unclear — that has to be observed in real workloads. Since KV is light, there’s room to push to 1M ctx with YaRN, but holding quality at that size is a separate problem.
Direction
For now I’m leaning toward placing Qwen3.5-397B-A17B as grandpa (the resident orchestrator). On raw reasoning (active params) GLM-5.1’s active 40B is the better pick, but for “stay resident and coordinate with other models”, Qwen3.5’s properties seem to line up better — that’s my current read.
- ctx 262k + light KV: at 16 MiB/1k ctx can go wide, and it also lines up with image-handling use cases
- PP 1,500 t/s: cache-miss recovery is 3× faster than GLM-5.1. The orchestrator frequently rewrites the system prompt and the stacked messages[], so cheap re-evaluation directly improves perceived latency
- License and optimization: both are MIT / Apache-2.0 and usable as SFT/DPO/LoRA flywheel targets, but GLM-5.1 is so large that fine-tuning iterations would be rough cost-wise. Qwen3.5-397B-A17B just barely fits within reach
Progress
About 2 months in. Weekday slots are limited to maybe 2 days, so I’ve been moving it forward on weekends too. After building out a batch of local-LLM-oriented MCP tools alongside claude and codex, the thing I keep coming back to is that “ctx should be small, dense, and timed”. The hardest piece I’m still iterating on is how to get models to coordinate with each other — I think about it on walks and keep tearing things down and rebuilding. That part is a lot of fun.
Summary
GLM-5.1 IQ3_KS delivered a stable 17–19 tok/s TG with the head 15 + tail 4 expert GPU placement. My guess is that weighting toward the head side for GPU placement helps with hit rate. Active 40B brings real weight, but combined with RAG for a small-ctx operation it looks really good.
For the resident orchestrator (grandpa) in my own familiar, I’m currently leaning toward Qwen3.5-397B-A17B. GLM-5.1 wins on active 40B reasoning power, but ctx 262k, KV 16 MiB/1k, PP 1,500 t/s, cache checkpoint restore, and general headroom all pull toward Qwen3.5.
The rest is running it in real workloads — watching delegation success rate, recovery counts, and session length while validating this direction. Data collection, tooling refinement — there’s plenty left to do.