Optimizing a GLM-5.1 + Qwen3-Coder-Next Stack: Orchestrator TG Benchmarks and Final Layout Design
A benchmark record for running GLM-5.1 (744B MoE, IQ3_KS) as the familiar orchestrator. Compares full cpu-moe, 1GPU vs 2GPU, n-cpu-moe, and head+tail tensor overrides, then carries the result into a final layout plan with Qwen3-Coder-Next workers.

In real familiar operation, the orchestrator is responsible for worker planning, review, and convergence decisions. If the grandpa lane is slow, overall turn latency collapses no matter how fast the workers are. What I wanted to pin down here was twofold: the TG behavior of GLM-5.1 IQ3_KS when used as the orchestrator, and how far I could push the full layout into something practical once Qwen3-Coder-Next workers were added beside it.
The short version is this: even in full --cpu-moe mode, GLM-5.1 still uses GPU for part of the path, but CPU expert evaluation remains dominant, so going from 1 GPU to 2 GPUs barely changes anything. The only changes that moved the needle were expert placement changes. In particular, explicitly placing head 12 layers plus tail 10 layers across 2 GPUs via -ot improved throughput from 53.09ms/token to 45.98ms/token, or 18.84 t/s to 21.75 t/s. Once I then budgeted VRAM under the assumption of running two Qwen3-Coder-Next Q4_0 --parallel 2 workers, the resident layout became much clearer.
Conclusion
The measurements and aggregation in this run were enough to make a few operational conclusions directly.
| Topic | What seems settled |
|---|---|
| CPU bottleneck | CPU evaluation of expert FFNs accounts for roughly 45-50ms/token, or 85-90% of total time |
| Meaning of 2 GPUs | With full cpu-moe, 2 GPUs behave like 1 GPU, with 53.09 vs 53.03 ms/token |
| Real source of improvement | n-cpu-moe 64 gives +5.7%, while -ot head12+tail10 gives +15.3% |
| Hot layers | Head+tail over 22 layers works materially better than tail-only over 14 layers; head is clearly hot |
| Context resilience | TG stays near 53ms at 61t and around 54-55ms even at 4096t |
-ger | Improves CPU-side expert execution by 1-2%, plausibly via better L3 locality |
-sm graph | Unsupported on GLM-DSA and falls back to layer |
| thinking | Not worth it for orchestrator use. 61 content tokens plus 294 reasoning tokens turns 4.6s into 19.1s |
If I only cared about the fastest standalone orchestrator, the 22-layer head+tail layout was the winner. In real operation, though, the orchestrator has to share VRAM with workers. That makes it more realistic to settle GLM-5.1 around a 20-layer GPU expert budget while prioritizing Qwen3-Coder-Next quality and worker throughput.
What Looks Confirmed
CPU Is Dominant
- CPU evaluation of expert FFNs dominates total generation time at around
45-50ms/token - Startup logs show
llm_load_tensors: offloaded 80/80 layers to GPU, so GPU layer compute itself is active - GPU utilization under full cpu-moe sits around
17-19% - PCIe transfer is not a controlling term. Activation size is about
12KB/layer, and even across 79 layers the transfer estimate is only around19μs - 2GPU layer-split is effectively meaningless in full cpu-moe mode. 1GPU and 2GPU are functionally equivalent in TG
At that point the right reading was not “the GPU is slow,” but “the GPU is idle while waiting for CPU expert evaluation.”
Expert Placement Improves TG
| Configuration | GPU expert layers | ms/token | TG (t/s) | Improvement |
|---|---|---|---|---|
| full cpu-moe (expert 0) | 0 | 53.0 | 18.8 | baseline |
| n-cpu-moe 64 | 14 | 50.2 | 19.9 | +5.7% |
-ot head12+tail10 | 22 | 46.0 | 21.8 | +15.3% |
Head Layers Are Hot
- Tail-only over 14 layers improved TG by
+5.7% - Head 12 plus tail 10 improved TG by
+15.3% - The GPU-resident layer count only increased by
1.57x, but the gain grew by roughly2.5x, which strongly suggests denser activation on the head side
High Context Tolerance
- TG stays nearly flat from
61tto4096t - MLA compresses KV enough to keep
32k ctxaround1.5GB - Because CPU expert evaluation dominates, context growth has relatively little leverage over total decode time
-ger Has a Real Effect
- The gain is small but consistent:
50.55 -> 50.16 ms/token - Grouped expert routing appears to play slightly better with the large L3 cache on
EPYC 9175F
-sm graph Is Unsupported on GLM-DSA
- Even when explicitly requested, it falls back to
layer - On this model, split mode is not where the useful optimization work is
Thinking Is Unnecessary for Orchestrator Work
- Adding
294reasoning tokens to an output that only needs61answer tokens turns4.6sinto19.1s --reasoning-budget 0orenable_thinking: falseshould be the default
Background
The role split in this setup was straightforward.
| Role | Purpose | Model |
|---|---|---|
| grandpa | Orchestrator review, judgment, and contract consistency checks | GLM-5.1 IQ3_KS |
| naughty-worker | Code generation, edits, and file output | Qwen3-Coder-Next |
On the worker side, I want the best coding quality I can afford. On the grandpa side, I want enough quality while pushing TG as low as possible. That tradeoff is why I started by measuring expert placement on GLM-5.1 first.
Hardware
  GPU:  NVIDIA RTX PRO 6000 Blackwell Max-Q 96GB × 2
CPU:  AMD EPYC 9175F (16 cores)
RAM:  768GB DDR5 6400MT/s
In this discussion, the value of 2 GPUs is mostly capacity rather than bandwidth. Under full cpu-moe, the GPUs can still sit mostly idle. As soon as experts start moving back onto GPU, though, a number of plausible layouts stop fitting on a single card.
GLM-5.1 Model Overview
The key model metadata extracted from startup logs was:
  llm_load_print_meta: arch                 = glm-dsa
llm_load_print_meta: model type           = 744B.A40B
llm_load_print_meta: model ftype          = IQ3_KS - 3.1875 bpw
llm_load_print_meta: model params         = 753.864 B
llm_load_print_meta: model size           = 320.216 GiB (3.649 BPW)
llm_load_print_meta: n_layer              = 79
llm_load_print_meta: n_expert             = 256
llm_load_print_meta: n_expert_used        = 8
llm_load_print_meta: n_layer_dense_lead   = 3
The broad structure is:
layer 0-2: denselayer 3-77: MoElayer 78: nextn predictionlayer 79: output
There are 75 MoE layers. Per layer, expert weights are roughly:
  gate_exps = 1225 MiB
down_exps = 1638 MiB
up_exps   = 1225 MiB
That puts each expert layer at about 4.1GB. Total expert weight is roughly 307GB, which is why pushing all experts into CUDA_Host inflates RAM usage so dramatically. By contrast, non-expert GPU-side weight is only around 14.5GB, KV is around 1.5GB, and compute buffer is around 5.4GB, so a no-GPU-expert layout leaves the GPUs mostly underused.
Base Command
The baseline ik_llama.cpp launch shape for GLM-5.1 was:
  podman run --rm \
  --device nvidia.com/gpu=1 \
  -p 8000:8000 \
  --cap-add=SYS_NICE \
  -v /mnt/data/models/models--ubergarm--GLM-5.1-GGUF:/models:ro,Z \
  registry.home.arpa/ik_llama.cpp:latest \
  -m /models/snapshots/.../IQ3_KS/GLM-5.1-IQ3_KS-00001-of-00008.gguf \
  --merge-qkv --ctx-size 32768 -ctk q8_0 -ctv q8_0 \
  --parallel 1 --threads 15 --threads-batch 24 \
  -b 8192 -ub 8192 -ngl 999 \
  --cpu-moe -muge -mla 3 -amb 512 \
  --jinja --host 0.0.0.0 --port 8000 \
  --warmup-batch --alias GLM-5.1
Main option meanings:
--cpu-moe: place all MoE expert weights in pinned CPU-side memory-muge: mergeffn_upandgate_exps-mla 3: MLA optimization level 3-amb 512: attention max batch size-ctk q8_0 -ctv q8_0: quantized KV cache
Method
I used two prompts for TG comparison:
- a short JSON generation request
- a long OpenAPI spec generation request
The short JSON case is close to review replies and contract-level judgments. The long OpenAPI case serves as a useful long-output load. I compared both with and without thinking, reading both timings.predicted_ms / predicted_n and the llama.cpp eval time logs.
  # short-output test
curl -s -w "\n\nTotal time: %{time_total}s\n" \
 http://compute.home.arpa:8000/v1/chat/completions \
 -H "Content-Type: application/json" \
 -d '{
"model": "GLM-5.1",
"messages": [
{"role": "user", "content": "Write a JSON object with 5 fields describing a software project. Include name, language, version, description, and license."}
],
"max_tokens": 256,
"temperature": 0.7,
"top_p": 0.95,
"top_k": 45,
"min_p": 0.01,
"chat_template_kwargs": {"enable_thinking": false}
}'
  # long-output test
curl -s -w "\n\nTotal time: %{time_total}s\n" \
 http://compute.home.arpa:8000/v1/chat/completions \
 -H "Content-Type: application/json" \
 -d '{
"model": "GLM-5.1",
"messages": [
{"role": "user", "content": "Write a detailed OpenAPI 3.0 specification in JSON for a task management API. Include endpoints for CRUD operations on projects and tasks, with request/response schemas, error responses, and authentication via Bearer token."}
],
"max_tokens": 2048,
"temperature": 0.7,
"top_p": 0.95,
"top_k": 45,
"min_p": 0.01,
"chat_template_kwargs": {"enable_thinking": false}
}'
How I Concluded It Was CPU-Bound
The most important result was being able to say fairly early that CPU-side expert evaluation was dominating total runtime.
Expert Computation Is Almost Everything
- Baseline TG is around
53ms/token - Roughly
45-50ms/tokenof that appears to be CPU-side expert evaluation - Non-expert GPU-side work, KV, and compute account for the remainder
With GPU utilization stuck around 17-19% while CPU rises to 1500%, the interpretation is consistent with the machine-level observations.
PCIe Is Not the Culprit
It is tempting to suspect activation transfer between CPU and GPU first, but the numbers do not support it.
- Activation size is about
12KB/layer - Even across all
79layers, transfer volume stays small - The transfer-time estimate is only around
19μs
That means PCIe is negligible against a 53ms TG. The slow part is not movement. It is CPU-side expert evaluation.
The Reason for High Context Tolerance Is the Same
The reason TG stays nearly flat across 61, 2048, and 4096 tokens is that attention growth is not becoming dominant. MLA keeps KV at about 1.5GB even at 32k ctx, and CPU expert work is the real bottleneck first. That behavior is quite different from dense or fully GPU-resident models.
Configuration 1: Hybrid -ot exps=CPU, 2GPU layer-split
The first measurement used -ot exps=CPU, placing all experts on CPU.
  podman run --rm \
  --device nvidia.com/gpu=all \
  -p 8000:8000 \
  --cap-add=SYS_NICE \
  -v /mnt/data/models/models--ubergarm--GLM-5.1-GGUF:/models:ro,Z \
  registry.home.arpa/ik_llama.cpp:latest \
  -m /models/snapshots/a9962c23e50d9c352e09fe0d9cb131026f4e6441/IQ3_KS/GLM-5.1-IQ3_KS-00001-of-00008.gguf \
  --merge-qkv --ctx-size 32768 -ctk q8_0 -ctv q8_0 --parallel 1 --threads 15 --threads-batch 24 -b 8192 -ub 8192 -ngl 99 -ot exps=CPU -muge -mla 3 -amb 512 -sm graph --jinja --host 0.0.0.0 --port 8000 --warmup-batch --alias GLM-5.1
The startup values looked like this:
  Split mode 'graph' is not supported for this model
  => changing split mode to 'layer'

llm_load_tensors:  CUDA_Host buffer size = 307110.47 MiB
llm_load_tensors:      CUDA0 buffer size =  7378.05 MiB
llm_load_tensors:      CUDA1 buffer size =  7120.90 MiB

llama_init_from_model: grouped er    = 0
llama_init_from_model: graph splits = 190
TG came out as:
  # short output, thinking off
prompt eval time =    1323.95 ms /    30 tokens (   44.13 ms per token,    22.66 tokens per second)
       eval time =    3238.59 ms /    61 tokens (   53.09 ms per token,    18.84 tokens per second)

# long output, thinking off
prompt eval time =    1831.66 ms /    43 tokens (   42.60 ms per token,    23.48 tokens per second)
       eval time =  111609.04 ms /  2048 tokens (   54.50 ms per token,    18.35 tokens per second)

# long output, thinking on
prompt eval time =    2459.53 ms /    43 tokens (   57.20 ms per token,    17.48 tokens per second)
       eval time =  226282.06 ms /  4096 tokens (   55.24 ms per token,    18.10 tokens per second)
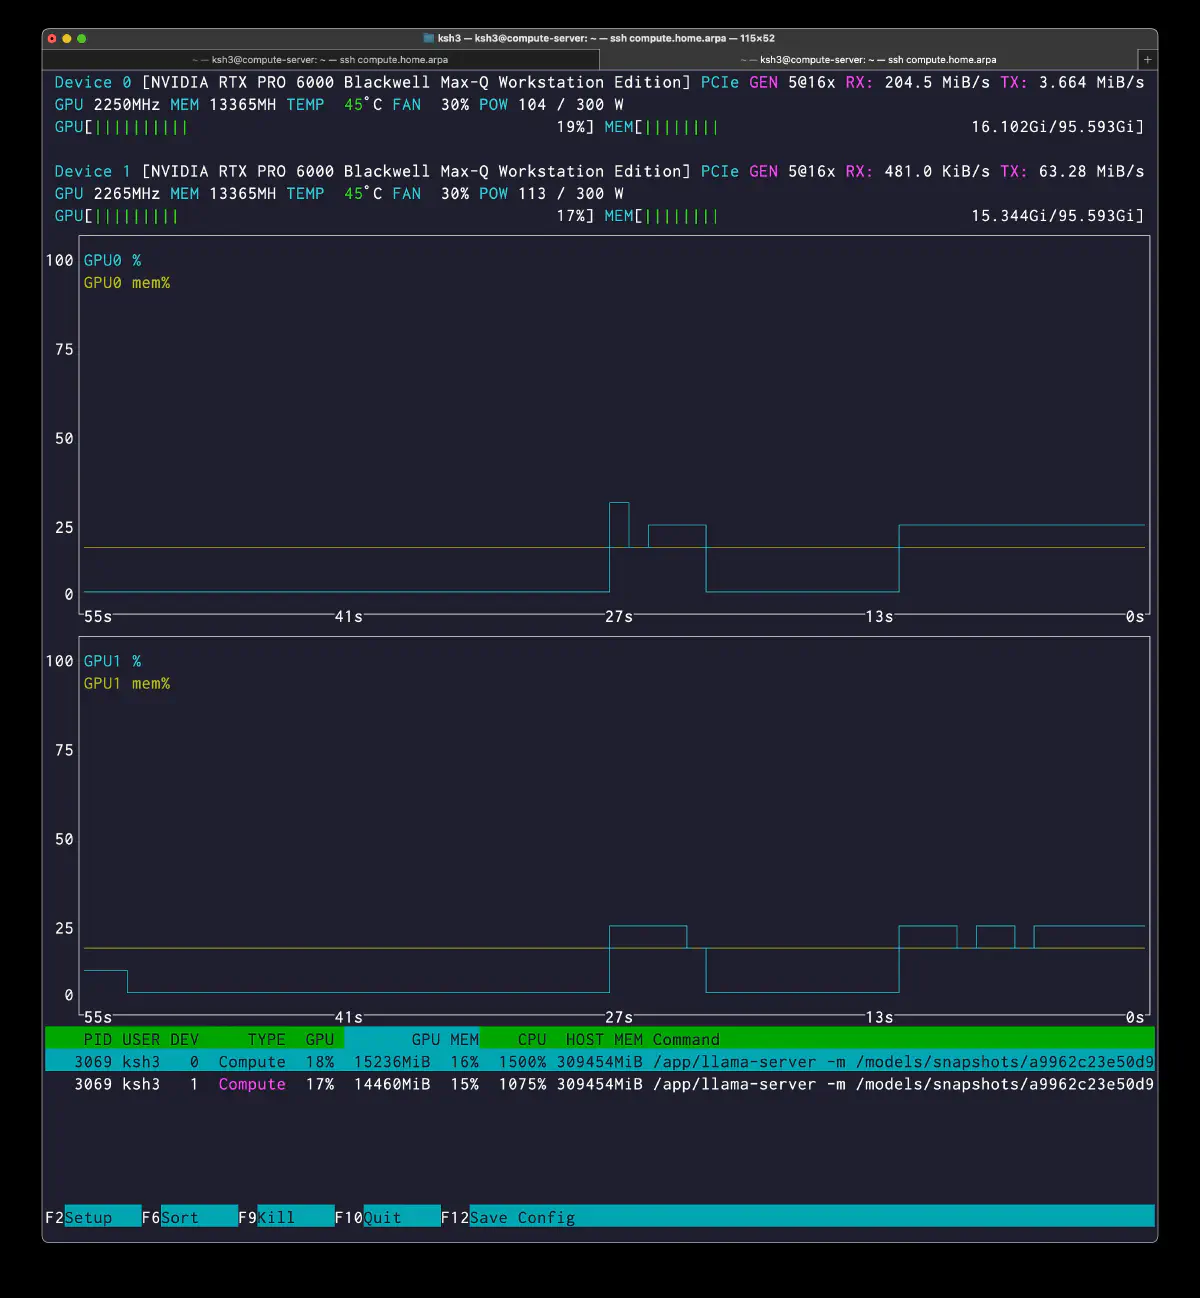
The nvtop view was very clear:
  PID USER DEV     TYPE  GPU        GPU MEM    CPU  HOST MEM
3069 ksh3   0  Compute  19%  15236MiB  16%  1500% 309454MiB
3069 ksh3   1  Compute  17%  14460MiB  15%  1075% 309454MiB
Configuration 2: Hybrid --cpu-moe, 2GPU
Next I repeated the same experiment using --cpu-moe rather than -ot exps=CPU. The goal was to verify whether the two behaved identically in practice.
  podman run --rm \
  --device nvidia.com/gpu=all \
  -p 8000:8000 \
  --cap-add=SYS_NICE \
  -v /mnt/data/models/models--ubergarm--GLM-5.1-GGUF:/models:ro,Z \
  registry.home.arpa/ik_llama.cpp:latest \
  -m /models/snapshots/a9962c23e50d9c352e09fe0d9cb131026f4e6441/IQ3_KS/GLM-5.1-IQ3_KS-00001-of-00008.gguf \
  --merge-qkv --ctx-size 32768 -ctk q8_0 -ctv q8_0 --parallel 1 --threads 15 --threads-batch 24 -b 8192 -ub 8192 -ngl 99 --cpu-moe -muge -mla 3 -amb 512 -sm graph --jinja --host 0.0.0.0 --port 8000 --warmup-batch --alias GLM-5.1 --temp 0.7 --top-k 45 --top-p 0.95 --min-p 0.01
The measured values were effectively identical:
  Split mode 'graph' is not supported for this model
  => changing split mode to 'layer'

llm_load_tensors:  CUDA_Host buffer size = 307110.47 MiB
llm_load_tensors:      CUDA0 buffer size =  7378.05 MiB
llm_load_tensors:      CUDA1 buffer size =  7120.90 MiB

llama_init_from_model: graph splits = 190
  # short output, thinking off
prompt eval time =    1323.95 ms /    30 tokens (   44.13 ms per token,    22.66 tokens per second)
       eval time =    3238.59 ms /    61 tokens (   53.09 ms per token,    18.84 tokens per second)

# long output, thinking off
prompt eval time =    1831.66 ms /    43 tokens (   42.60 ms per token,    23.48 tokens per second)
       eval time =  111609.04 ms /  2048 tokens (   54.50 ms per token,    18.35 tokens per second)
So in this model and build, -ot exps=CPU and --cpu-moe produced the same buffer layout and the same performance. From here onward, I treat both together as “full cpu-moe.”
Configuration 3: Hybrid --cpu-moe, 1GPU
I then switched to a single-GPU layout on dev1 to check whether 2GPU layer-split overhead might be hurting more than helping.
  podman run --rm \
  --device nvidia.com/gpu=1 \
  -p 8000:8000 \
  --cap-add=SYS_NICE \
  -v /mnt/data/models/models--ubergarm--GLM-5.1-GGUF:/models:ro,Z \
  registry.home.arpa/ik_llama.cpp:latest \
  -m /models/snapshots/a9962c23e50d9c352e09fe0d9cb131026f4e6441/IQ3_KS/GLM-5.1-IQ3_KS-00001-of-00008.gguf \
  --merge-qkv --ctx-size 32768 -ctk q8_0 -ctv q8_0 --parallel 1 --threads 15 --threads-batch 24 -b 8192 -ub 8192 -ngl 999 --cpu-moe -muge -mla 3 -amb 512 --jinja --host 0.0.0.0 --port 8000 --warmup-batch --alias GLM-5.1 --temp 0.7 --top-k 45 --top-p 0.95 --min-p 0.01
Startup values on 1GPU:
  llm_load_tensors:  CUDA_Host buffer size = 307110.47 MiB
llm_load_tensors:      CUDA0 buffer size = 14498.95 MiB

llama_kv_cache_init:      CUDA0 KV buffer size = 1491.79 MiB
llama_init_from_model:    CUDA0 compute buffer size = 5418.03 MiB
llama_init_from_model: graph splits = 152

Allocating 299.91 GiB of pinned host memory
done allocating 299.91 GiB in 46485.7 ms
The performance difference was tiny:
  # short output, thinking off
prompt eval time =    1297.67 ms /    30 tokens (   43.26 ms per token,    23.12 tokens per second)
       eval time =    3340.94 ms /    63 tokens (   53.03 ms per token,    18.86 tokens per second)

# long output, thinking off
prompt eval time =    1823.10 ms /    43 tokens (   42.40 ms per token,    23.59 tokens per second)
       eval time =  110967.85 ms /  2048 tokens (   54.18 ms per token,    18.46 tokens per second)

# long output, thinking on
prompt eval time =    1696.37 ms /    43 tokens (   39.45 ms per token,    25.35 tokens per second)
       eval time =  222410.35 ms /  4096 tokens (   54.30 ms per token,    18.42 tokens per second)
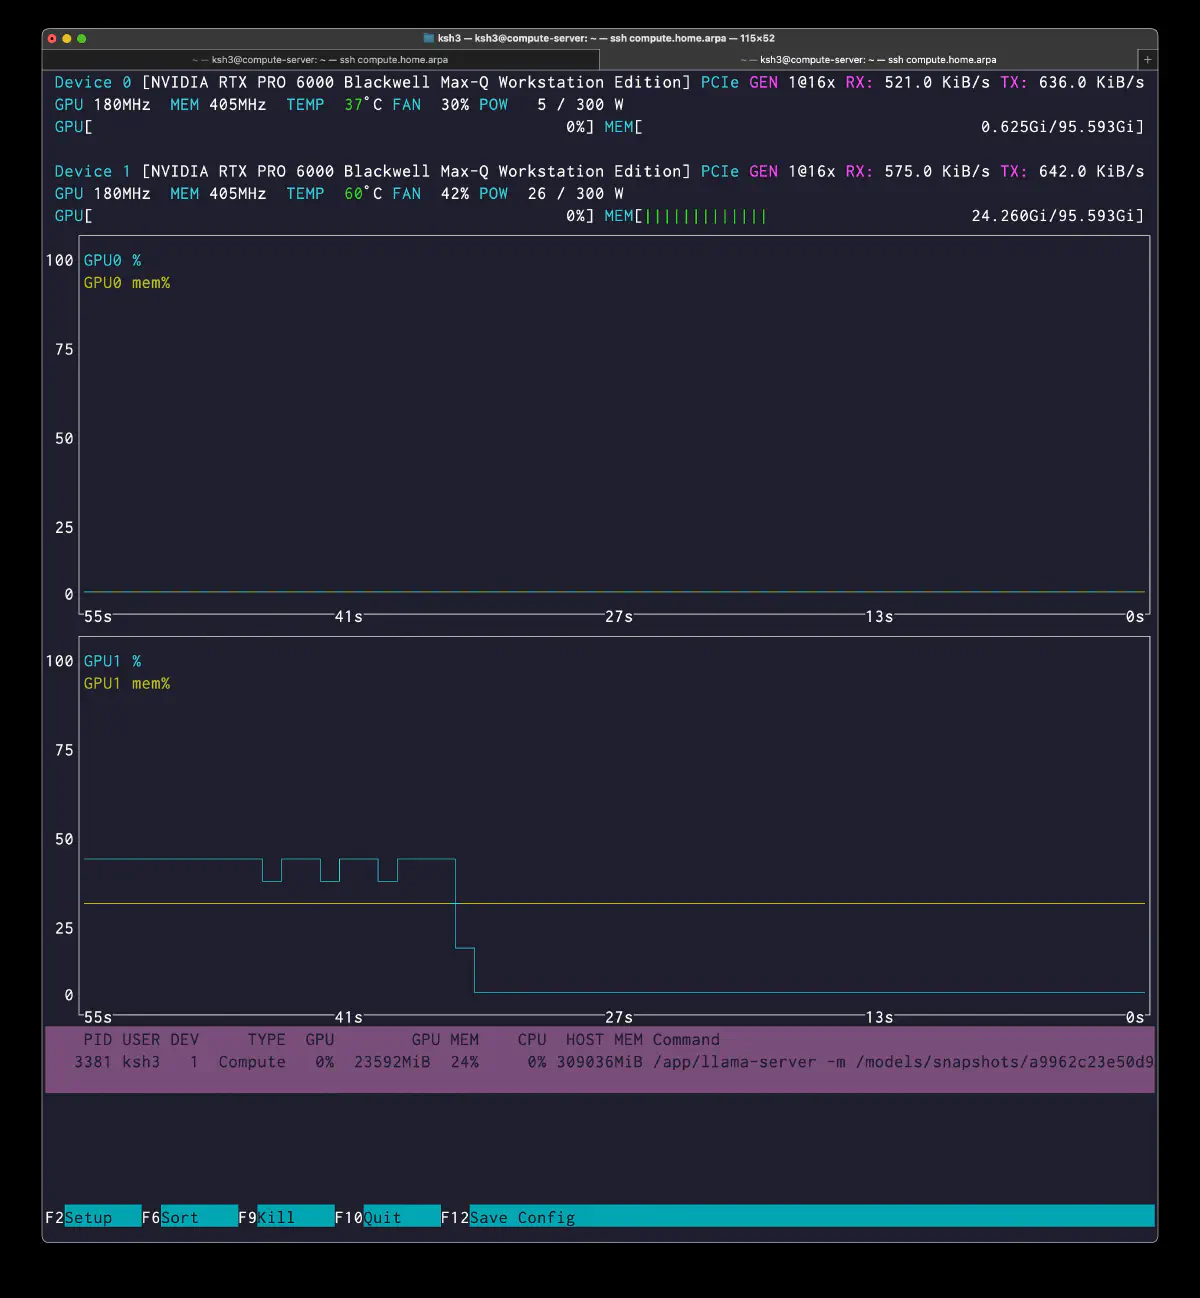
  PID USER DEV     TYPE  GPU        GPU MEM    CPU  HOST MEM
3381 ksh3   1  Compute   0%  23592MiB  24%     0% 309036MiB
There are two useful readings here:
graph splitsdrops from190to152, so the 1GPU graph is structurally simpler- TG remains almost unchanged, meaning CPU expert evaluation is still the real bottleneck
So 2GPU is not making it faster, but 1GPU is not making it meaningfully worse either. That matters because it means freeing dev0 for worker use is entirely reasonable.
Configuration 4: Hybrid --n-cpu-moe 64, 1GPU, -ger
This is where I started moving experts back to GPU. --n-cpu-moe 64 keeps earlier experts on CPU while returning later experts to GPU.
  podman run --rm \
  --device nvidia.com/gpu=1 \
  -p 8000:8000 \
  --cap-add=SYS_NICE \
  -v /mnt/data/models/models--ubergarm--GLM-5.1-GGUF:/models:ro,Z \
  registry.home.arpa/ik_llama.cpp:latest \
  -m /models/snapshots/a9962c23e50d9c352e09fe0d9cb131026f4e6441/IQ3_KS/GLM-5.1-IQ3_KS-00001-of-00008.gguf \
  --merge-qkv --ctx-size 32768 -ctk q8_0 -ctv q8_0 --parallel 1 --threads 15 --threads-batch 24 -b 8192 -ub 8192 -ngl 999 --n-cpu-moe 64 -muge -mla 3 -amb 512 --jinja --host 0.0.0.0 --port 8000 --warmup-batch -ger --alias GLM-5.1 --temp 0.7 --top-k 45 --top-p 0.95 --min-p 0.01
The effective interpretation is:
blk.3-63: CPU-sideblk.64-77: GPU-side- in practice, tail 14 MoE layers returned to GPU
Allocating 244.02 GiB of pinned host memory
TG improved clearly for the first time:
  # short output, thinking off
prompt eval time =    1173.39 ms /    30 tokens (   39.11 ms per token,    25.57 tokens per second)
       eval time =    3109.75 ms /    62 tokens (   50.16 ms per token,    19.94 tokens per second)

# long output, thinking off
prompt eval time =    1690.07 ms /    43 tokens (   39.30 ms per token,    25.44 tokens per second)
       eval time =  103526.50 ms /  2048 tokens (   50.55 ms per token,    19.78 tokens per second)

# long output, thinking on
prompt eval time =    1664.97 ms /    43 tokens (   38.72 ms per token,    25.83 tokens per second)
       eval time =  207284.39 ms /  4096 tokens (   50.61 ms per token,    19.76 tokens per second)
nvtop made the GPU-side change obvious:
  PID USER DEV     TYPE  GPU        GPU MEM    CPU  HOST MEM
4153 ksh3   1  Compute  41%  80804MiB  83%  1432% 251746MiB
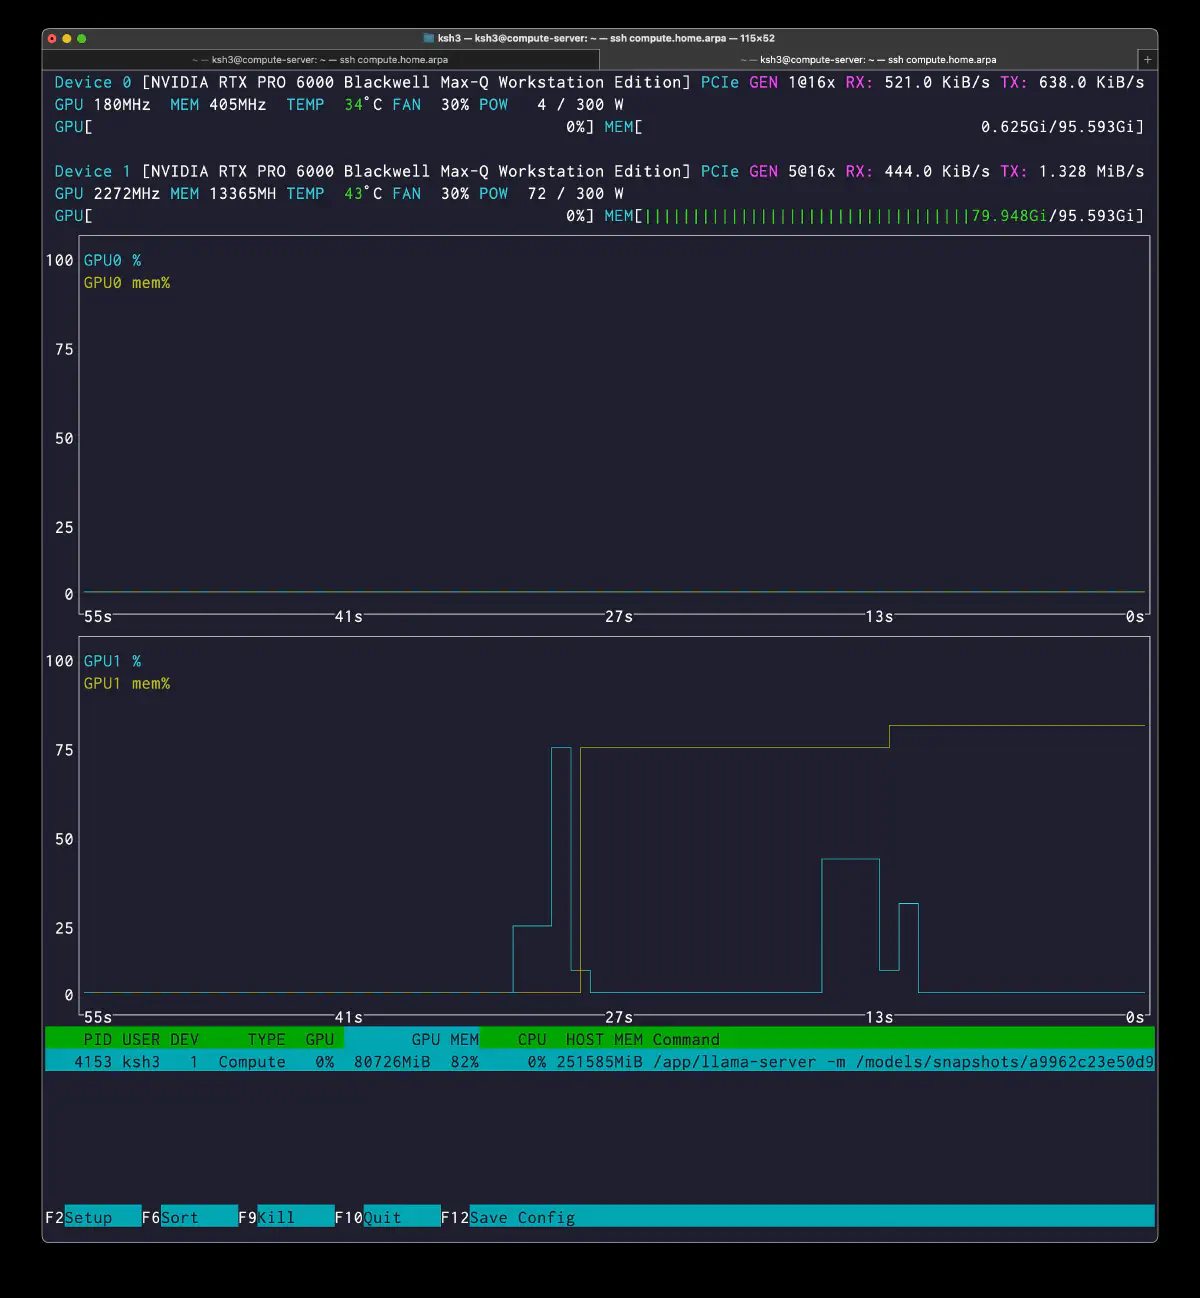
The gain was +5.7%. Not dramatic, but enough to prove that GPU-resident experts do matter.
Failure Case: Hybrid --n-cpu-moe 58, 1GPU -> OOM
I also tried pushing toward a 20-layer GPU expert budget on 1GPU, but --n-cpu-moe 58 failed cleanly with OOM.
  podman run --rm \
  --device nvidia.com/gpu=1 \
  -p 8000:8000 \
  --cap-add=SYS_NICE \
  -v /mnt/data/models/models--ubergarm--GLM-5.1-GGUF:/models:ro,Z \
  registry.home.arpa/ik_llama.cpp:latest \
  -m /models/snapshots/a9962c23e50d9c352e09fe0d9cb131026f4e6441/IQ3_KS/GLM-5.1-IQ3_KS-00001-of-00008.gguf \
  --merge-qkv --ctx-size 32768 -ctk q8_0 -ctv q8_0 --parallel 1 --threads 15 --threads-batch 24 -b 8192 -ub 8192 -ngl 999 --n-cpu-moe 58 -muge -mla 3 -amb 512 --jinja --host 0.0.0.0 --port 8000 --warmup-batch -ger --alias GLM-5.1 --temp 0.7 --top-k 45 --top-p 0.95 --min-p 0.01
  ggml_backend_cuda_buffer_type_alloc_buffer: allocating 5418.03 MiB on device 0: cudaMalloc failed: out of memory
ggml_gallocr_reserve_n: failed to allocate CUDA0 buffer of size 5681217536
llama_init_from_model: failed to allocate compute buffers
Trying to hold something close to 20 expert layers on a single 96GB card simply does not fit once non-expert weight, KV, and compute buffers are included.
Configuration 5: Hybrid -ot head12+tail10, 2GPU, -ger
The best result came from explicit placement. I pinned head and tail experts to separate GPUs.
  OT_ARGS=""
for i in $(seq 3 14); do
  OT_ARGS="$OT_ARGS -ot blk.$i.ffn_gate_exps=CUDA0"
  OT_ARGS="$OT_ARGS -ot blk.$i.ffn_down_exps=CUDA0"
  OT_ARGS="$OT_ARGS -ot blk.$i.ffn_up_exps=CUDA0"
done
for i in $(seq 68 77); do
  OT_ARGS="$OT_ARGS -ot blk.$i.ffn_gate_exps=CUDA1"
  OT_ARGS="$OT_ARGS -ot blk.$i.ffn_down_exps=CUDA1"
  OT_ARGS="$OT_ARGS -ot blk.$i.ffn_up_exps=CUDA1"
done

podman run --rm \
  --device nvidia.com/gpu=all \
  -p 8000:8000 \
  --cap-add=SYS_NICE \
  -v /mnt/data/models/models--ubergarm--GLM-5.1-GGUF:/models:ro,Z \
  registry.home.arpa/ik_llama.cpp:latest \
  -m /models/snapshots/a9962c23e50d9c352e09fe0d9cb131026f4e6441/IQ3_KS/GLM-5.1-IQ3_KS-00001-of-00008.gguf \
  --merge-qkv --ctx-size 32768 -ctk q8_0 -ctv q8_0 \
  --parallel 1 --threads 15 --threads-batch 24 \
  -b 8192 -ub 8192 -ngl 999 \
  --cpu-moe $OT_ARGS -ger \
  -muge -mla 3 -amb 512 \
  --jinja --host 0.0.0.0 --port 8000 \
  --warmup-batch --alias GLM-5.1
Observed startup values:
  Allocating 218045 MiB of pinned host memory

GPU0: 57190MiB (58%)
GPU1: 48756MiB (50%)
That means:
- GPU0: head 12 expert layers + earlier attention
- GPU1: tail 10 expert layers + later attention
- CPU: the middle 53 expert layers
This was the best PP/TG line of the whole run:
  # short output, thinking off
prompt eval time =    1111.85 ms /    30 tokens (   37.06 ms per token,    26.98 tokens per second)
       eval time =    2942.51 ms /    64 tokens (   45.98 ms per token,    21.75 tokens per second)

# long output, thinking off
prompt eval time =    2016.80 ms /    43 tokens (   46.90 ms per token,    21.32 tokens per second)
       eval time =   94650.69 ms /  2048 tokens (   46.22 ms per token,    21.64 tokens per second)

# long output, thinking on
prompt eval time =    1431.92 ms /    43 tokens (   33.30 ms per token,    30.03 tokens per second)
       eval time =  190089.65 ms /  4096 tokens (   46.41 ms per token,    21.55 tokens per second)
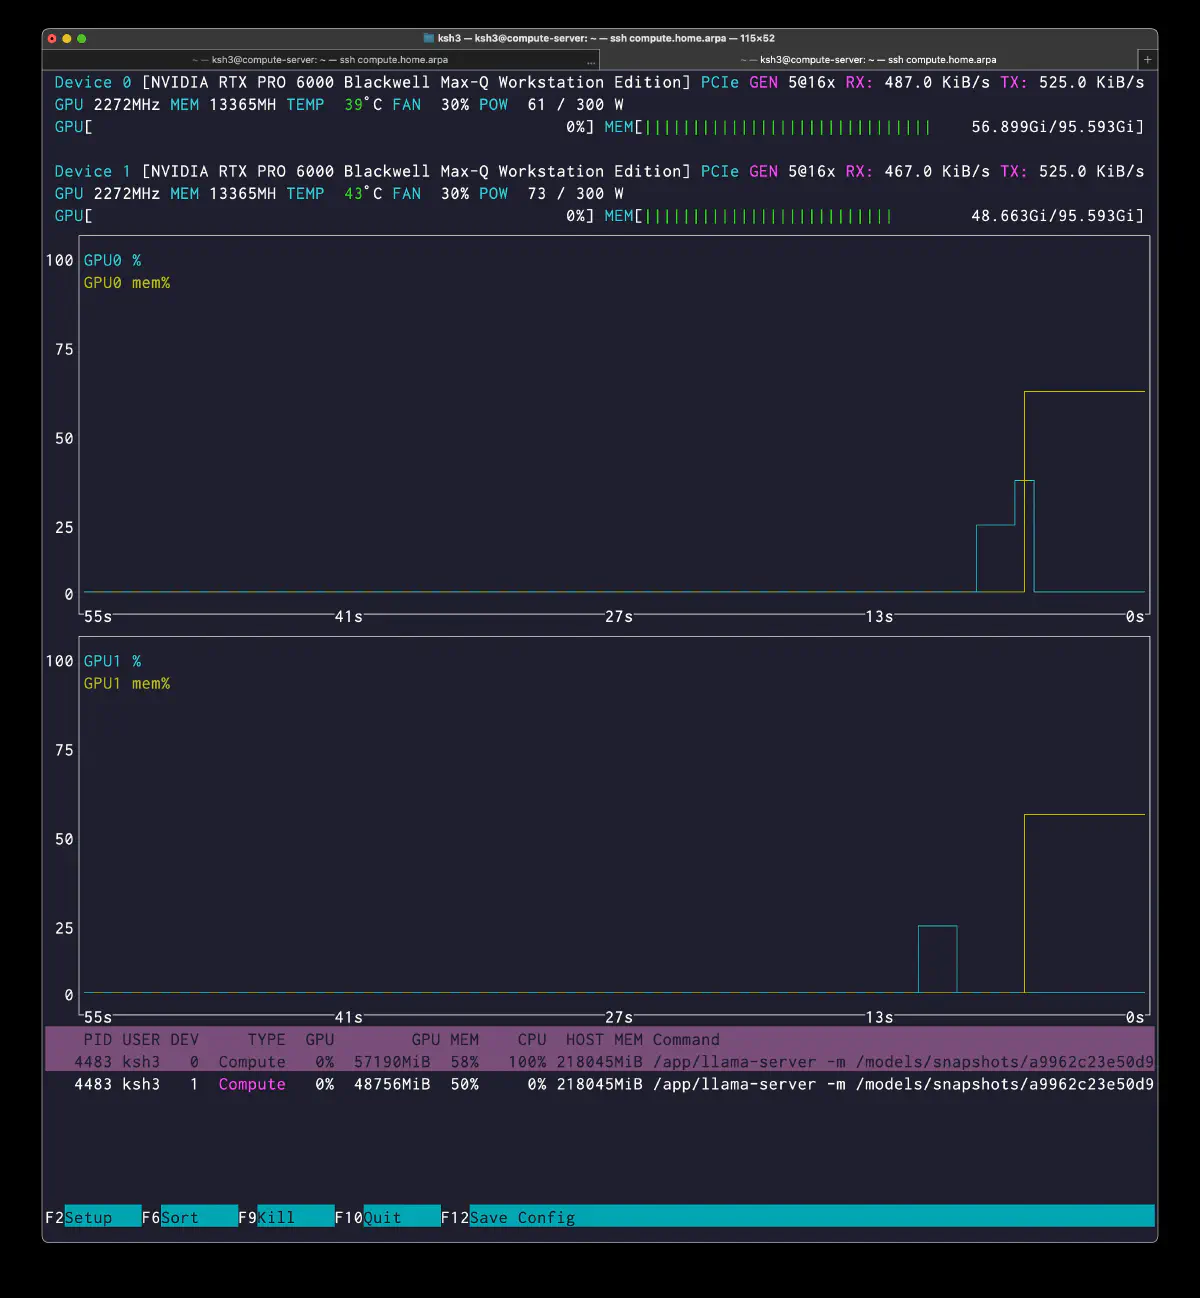
The nvtop view also shows a slight reduction in CPU pressure:
  PID USER DEV     TYPE  GPU        GPU MEM    CPU  HOST MEM
4483 ksh3   0  Compute  24%  64268MiB  66%  1355% 219523MiB
4483 ksh3   1  Compute  22%  55322MiB  57%  1194% 219523MiB
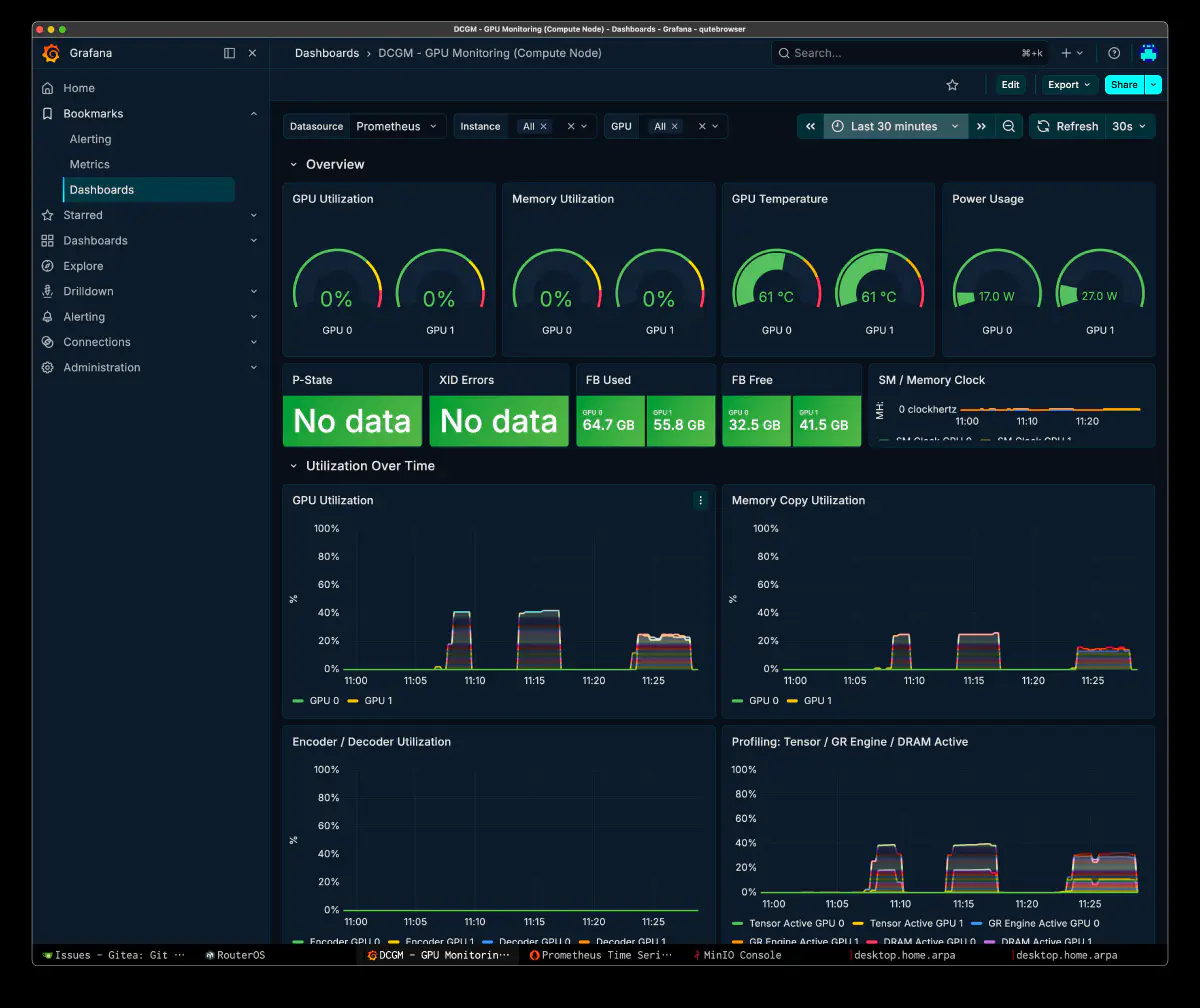
Grafana Monitoring
GPU utilization, memory copy, temperature, and power were monitored through DCGM exporter.
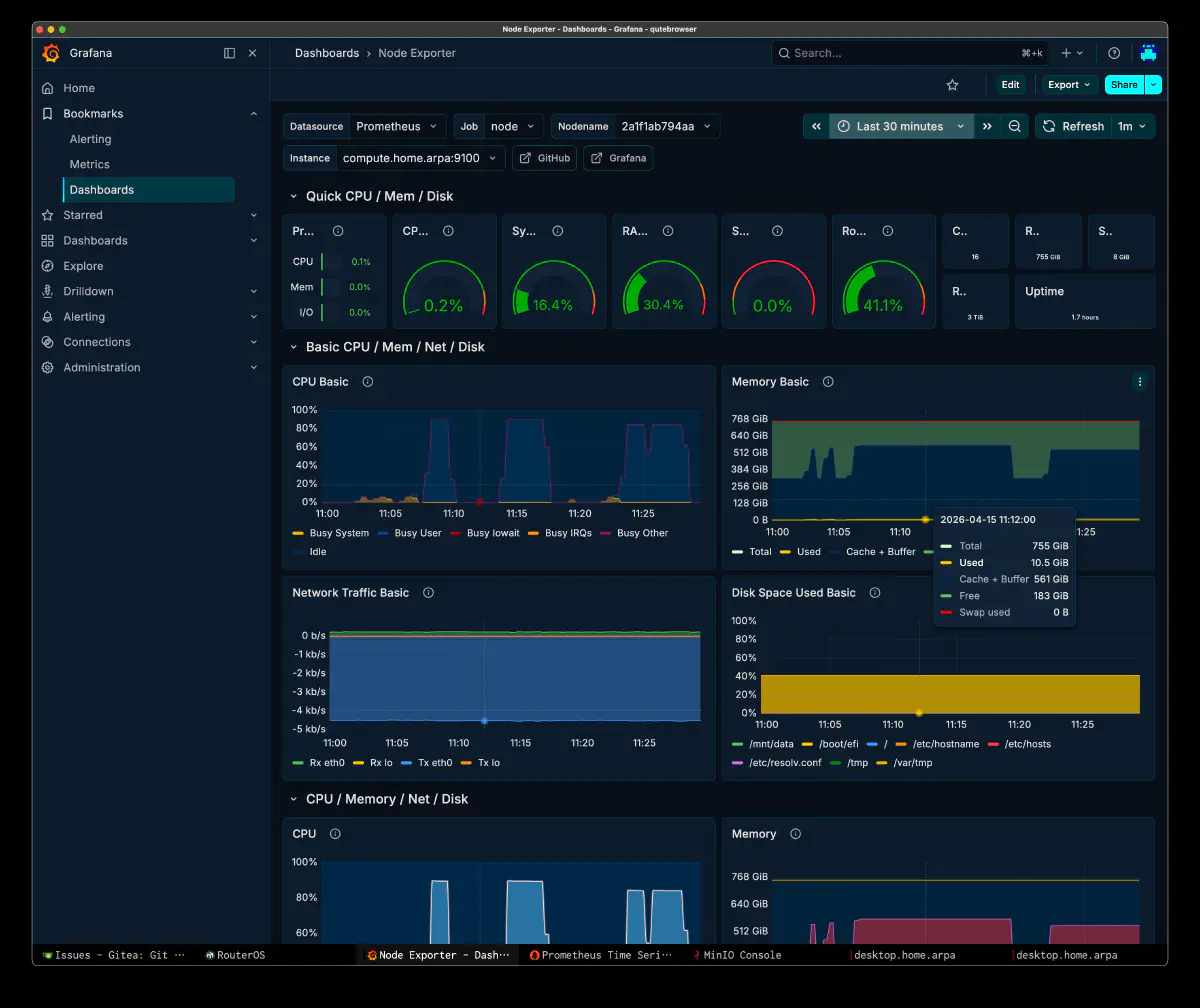
I also tracked CPU Busy User and host memory behavior via Node Exporter.
Benchmark Summary
TG (eval)
| # | Configuration | GPUs | GPU expert layers | Short TG | 2048t TG | 4096t TG | Improvement |
|---|---|---|---|---|---|---|---|
| 1 | hybrid -ot exps=CPU | 2 | 0 | 18.84 | 18.35 | 18.10 | baseline |
| 2 | hybrid --cpu-moe | 2 | 0 | 18.84 | 18.35 | 18.10 | ±0% |
| 3 | hybrid --cpu-moe | 1 | 0 | 18.86 | 18.46 | 18.42 | +0.1% |
| 4 | hybrid --n-cpu-moe 64 -ger | 1 | 14 (tail) | 19.94 | 19.78 | 19.76 | +5.8% |
| 5 | hybrid -ot head+tail -ger | 2 | 22 (h12+t10) | 21.75 | 21.64 | 21.55 | +15.4% |
PP (prompt eval)
| # | Configuration | Short PP | Long PP | Best PP |
|---|---|---|---|---|
| 1 | hybrid -ot exps=CPU 2GPU | 22.66 | 23.48 | 23.48 |
| 3 | hybrid --cpu-moe 1GPU | 23.12 | 23.59 | 25.35 |
| 4 | hybrid --n-cpu-moe 64 -ger | 25.57 | 25.44 | 25.83 |
| 5 | hybrid -ot head+tail -ger | 26.98 | 21.32 | 30.03 |
GPU Resource Comparison
| # | Configuration | VRAM dev0 | VRAM dev1 | GPU util | CPU% | pinned RAM |
|---|---|---|---|---|---|---|
| 1 | hybrid exps=CPU 2GPU | 15236MiB | 14460MiB | 17-19% | 1500% | 300GB |
| 3 | hybrid cpu-moe 1GPU | — | 23592MiB | 17-19% | 1500% | 300GB |
| 4 | hybrid n-cpu-moe 64 | — | 80804MiB | 41% | 1432% | 244GB |
| 5 | hybrid -ot head+tail | 57190MiB | 48756MiB | 22-24% x 2 | 1355% | 218GB |
Improvement Summary
  hybrid full cpu-moe (baseline):    18.84 tok/s
hybrid cpu-moe 1GPU:               18.86 tok/s  (+0.1%)
hybrid n-cpu-moe 64 -ger:          19.94 tok/s  (+5.8%)
hybrid -ot head12+tail10 -ger:     21.75 tok/s  (+15.4%)
Analysis
The Wall Is the CPU
As long as experts stay on CPU, the bottleneck is the CPU-side expert FFN evaluation before anything else. EPYC 9175F has 16 cores and a large L3, but that is still not enough to cheaply run 256 experts with 8 active per token. If 85-90% of TG lives there, the number of GPUs hardly matters.
Head Is Hot
Head+tail outperformed tail-only by too much for this to be explained by layer count alone. The gain curve strongly suggests that the head side carries denser or more useful expert activation.
The Value of 2 GPUs Is Capacity
Under full cpu-moe, 2 GPUs do not buy much. Once experts move back to GPU, that changes immediately. This becomes even more important when Qwen3-Coder-Next is also resident, because the orchestrator and workers begin competing directly for the same VRAM budget.
Thinking Is a Bad Trade Here
Thinking does not really change TG; it changes how many tokens get generated. Since the orchestrator mostly needs short judgments and short next-step instructions, spending heavily on reasoning tokens is not worth it.
-ger Is Small but Real
A 1-2% improvement sounds small, but it compounds when the review lane runs hundreds of times. Since the majority of experts still remain CPU-side, any L3-locality win is hard to dismiss.
Final Direction with Qwen3-Coder-Next Included
At this point the problem becomes a full resident layout problem rather than a GLM-only benchmark problem.
Qwen3-Coder-Next KV Efficiency
One reason Qwen3-Coder-Next is practical here is its KV efficiency.
  48 layers: 36 DeltaNet (no KV cache) + 12 Gated Attention (KV heads=2)
256k ctx: KV ~3GB
1M ctx (YaRN): KV ~11GB
Compared to a plain attention stack, that makes it much easier to hold long-context workers resident.
--parallel Strategy for Naughty
| parallel | per-slot ctx | Practicality for coding |
|---|---|---|
| 1 | 256k | Comfortable, but lower throughput |
| 2 | 128k | Practical baseline |
| 3 | 85k | Heavy tasks start to overflow |
| 4 | 64k | Too tight for agentic coding |
--parallel 2 looked like the practical floor. Most coding tasks fit inside 128k. YaRN leaves room to stretch much further, but the first priority is practical throughput at 128k x 2.
Quant Choice: Q4_0 for Qwen3-Coder-Next
| Quant | PPL | weights | grandpa expert budget |
|---|---|---|---|
IQ4_KSS | 8.31 | 39 GiB | 48GB/GPU |
Q4_0 | 8.25 | 45 GiB | 42GB/GPU |
The PPL gap is only 0.06, but worker-side code quality matters more. The cost is losing roughly 2-3 GLM expert layers worth of budget, or around a second per 1000 tokens. That trade still favors worker quality.
Final Layout
  dev0 (96GB):
  naughty-worker0: Q4_0, --parallel 2, 128k x 2
    weights 45GB + KV ~5.5GB + compute ~3GB = ~54GB
  grandpa expert (head side): ~42GB -> 10 layers

dev1 (96GB):
  naughty-worker1: Q4_0, --parallel 2, 128k x 2
    weights 45GB + KV ~5.5GB + compute ~3GB = ~54GB
  grandpa expert (tail+mid side): ~42GB -> 10 layers

grandpa non-expert/KV/compute: ~12GB/GPU (layer-split)
grandpa expert total: ~84GB -> 20 layers
CPU (768GB RAM): remaining 55 expert layers (~225GB pinned)
The target here is around ~47ms/token, or 21+ t/s. That does not quite reach the full 22-layer head+tail best of 46ms, but if I can keep two workers resident, overall throughput is likely better.
Expert Placement Plan (20 Layers)
  GPU0 (head-heavy):
  blk.3,4,5,6,7,8,9,10 + blk.20,30 = 10 layers

GPU1 (tail-heavy):
  blk.70,71,72,73,74,75,76,77 + blk.50,60 = 10 layers
That gives 8 head layers, 8 tail layers, and 4 middle layers. If it can land close to the full 22-layer result, it should be a good balance between worker residency and orchestrator speed.
Operational Impact on the Orchestrator
If I treat a review reply as roughly 1000 tokens, the configuration difference maps directly to turn length.
| Configuration | Time required |
|---|---|
| cpu-moe baseline (18.8 t/s) | 53s |
| n-cpu-moe 64 (19.9 t/s) | 50s |
-ot head+tail (21.6 t/s) | 46s |
A 7-second difference does not look huge in isolation, but it compounds quickly across 2 or 3 rounds. On the other hand, a full 22-layer head+tail layout reduces room for workers. That is why Phase 0 still needs real data on whether grandpa speed or naughty throughput contributes more to convergence.
Future Optimization Options
Custom GGUF Build
One option is to raise quant precision only for hot expert layers:
  # GPU layers (head 8 + tail 8)
blk\.(3|4|5|6|7|8|9|10)\.ffn_down_exps\.weight=iq6_k
blk\.(3|4|5|6|7|8|9|10)\.ffn_(gate|up)_exps\.weight=iq5_ks
blk\.(70|71|72|73|74|75|76|77)\.ffn_down_exps\.weight=iq6_k
blk\.(70|71|72|73|74|75|76|77)\.ffn_(gate|up)_exps\.weight=iq5_ks

# CPU layers (middle)
blk\..*\.ffn_down_exps\.weight=iq4_ks
blk\..*\.ffn_(gate|up)_exps\.weight=iq3_ks
That could improve strict parse-tier rate by raising quality where the GPU-resident hot layers matter most. The downside is VRAM growth on the order of ~19GB across 16 layers, so it directly trades against worker context.
Expert Activation Profiling
The next serious step is to use --metrics and verbose logging to measure per-layer activation frequency.
IQ4_K on the GLM Side
Moving from IQ3_KS to smol-IQ4_K could improve instruction-following quality. TG might drop by 10-15%, but if parse tier or convergence improves enough, the trade could still come out ahead.
Raw Benchmark Appendix
From here onward, I am preserving the raw benchmark material that fed the article directly. The intent is to keep the actual launch commands, startup logs, and PP/TG extracts searchable later with grep.
A. -ot exps=CPU 2GPU
  ggml_cuda_init: found 2 CUDA devices:
  Device 0: NVIDIA RTX PRO 6000 Blackwell Max-Q Workstation Edition, compute capability 12.0, VMM: yes, VRAM: 97247 MiB
  Device 1: NVIDIA RTX PRO 6000 Blackwell Max-Q Workstation Edition, compute capability 12.0, VMM: yes, VRAM: 97247 MiB

Split mode 'graph' is not supported for this model
  => changing split mode to 'layer'

llm_load_print_meta: model type       = 744B.A40B
llm_load_print_meta: model ftype      = IQ3_KS - 3.1875 bpw
llm_load_print_meta: model params     = 753.864 B
llm_load_print_meta: model size       = 320.216 GiB (3.649 BPW)

llm_load_tensors:  CUDA_Host buffer size = 307110.47 MiB
llm_load_tensors:      CUDA0 buffer size =  7378.05 MiB
llm_load_tensors:      CUDA1 buffer size =  7120.90 MiB

llama_init_from_model: n_ctx         = 32768
llama_init_from_model: n_batch       = 8192
llama_init_from_model: n_ubatch      = 8192
llama_init_from_model: flash_attn    = 1
llama_init_from_model: mla_attn      = 3
llama_init_from_model: attn_max_b    = 512
llama_init_from_model: fused_moe     = 1
llama_init_from_model: grouped er    = 0
llama_init_from_model: fused_up_gate = 1
llama_init_from_model: fused_mmad    = 1
llama_init_from_model: graph_reuse   = 1

llama_kv_cache_init:      CUDA0 KV buffer size =   784.15 MiB
llama_kv_cache_init:      CUDA1 KV buffer size =   707.64 MiB
llama_init_from_model: KV self size  = 1491.75 MiB

llama_init_from_model:      CUDA0 compute buffer size =  5418.03 MiB
llama_init_from_model:      CUDA1 compute buffer size =  5032.00 MiB
llama_init_from_model:  CUDA_Host compute buffer size =   704.09 MiB
llama_init_from_model: graph nodes  = 10250
llama_init_from_model: graph splits = 190

Allocating 299.91 GiB of pinned host memory
done allocating 299.91 GiB in 51786.7 ms
  # short output, thinking off (61 tokens)
prompt eval time =    1323.95 ms /    30 tokens (   44.13 ms per token,    22.66 tokens per second)
       eval time =    3238.59 ms /    61 tokens (   53.09 ms per token,    18.84 tokens per second)
      total time =    4562.54 ms /    91 tokens

# short output, thinking on (355 tokens = 294 thinking + 61 content)
prompt eval time =      55.51 ms /     1 tokens (   55.51 ms per token,    18.02 tokens per second)
       eval time =   19024.07 ms /   355 tokens (   53.59 ms per token,    18.66 tokens per second)
      total time =   19079.58 ms /   356 tokens

# long output, thinking off (2048 tokens)
prompt eval time =    1831.66 ms /    43 tokens (   42.60 ms per token,    23.48 tokens per second)
       eval time =  111609.04 ms /  2048 tokens (   54.50 ms per token,    18.35 tokens per second)
      total time =  113440.71 ms /  2091 tokens

# long output, thinking on (4096 tokens)
prompt eval time =    2459.53 ms /    43 tokens (   57.20 ms per token,    17.48 tokens per second)
       eval time =  226282.06 ms /  4096 tokens (   55.24 ms per token,    18.10 tokens per second)
      total time =  228741.58 ms /  4139 tokens
B. --cpu-moe 1GPU
  ggml_cuda_init: found 1 CUDA devices:
  Device 0: NVIDIA RTX PRO 6000 Blackwell Max-Q Workstation Edition, compute capability 12.0, VMM: yes, VRAM: 97247 MiB

llm_load_tensors:  CUDA_Host buffer size = 307110.47 MiB
llm_load_tensors:      CUDA0 buffer size = 14498.95 MiB

llama_kv_cache_init:      CUDA0 KV buffer size =  1491.79 MiB
llama_init_from_model:      CUDA0 compute buffer size =  5418.03 MiB
llama_init_from_model:  CUDA_Host compute buffer size =   704.09 MiB
llama_init_from_model: graph nodes  = 10250
llama_init_from_model: graph splits = 152

Allocating 299.91 GiB of pinned host memory
done allocating 299.91 GiB in 46485.7 ms
  # short output, thinking off (63 tokens)
prompt eval time =    1297.67 ms /    30 tokens (   43.26 ms per token,    23.12 tokens per second)
       eval time =    3340.94 ms /    63 tokens (   53.03 ms per token,    18.86 tokens per second)
      total time =    4638.61 ms /    93 tokens

# long output, thinking off (2048 tokens)
prompt eval time =    1823.10 ms /    43 tokens (   42.40 ms per token,    23.59 tokens per second)
       eval time =  110967.85 ms /  2048 tokens (   54.18 ms per token,    18.46 tokens per second)
      total time =  112790.94 ms /  2091 tokens

# long output, thinking on (4096 tokens)
prompt eval time =    1696.37 ms /    43 tokens (   39.45 ms per token,    25.35 tokens per second)
       eval time =  222410.35 ms /  4096 tokens (   54.30 ms per token,    18.42 tokens per second)
      total time =  224106.72 ms /  4139 tokens
C. --n-cpu-moe 64 -ger 1GPU
  ggml_cuda_init: found 1 CUDA devices:

# blk.3〜blk.63: CUDA_Host (55 MoE layers on CPU)
# blk.64〜blk.77: GPU (14 MoE layers)

Allocating 244.02 GiB of pinned host memory
  # short output, thinking off (62 tokens)
prompt eval time =    1173.39 ms /    30 tokens (   39.11 ms per token,    25.57 tokens per second)
       eval time =    3109.75 ms /    62 tokens (   50.16 ms per token,    19.94 tokens per second)
      total time =    4283.14 ms /    92 tokens

# long output, thinking off (2048 tokens)
prompt eval time =    1690.07 ms /    43 tokens (   39.30 ms per token,    25.44 tokens per second)
       eval time =  103526.50 ms /  2048 tokens (   50.55 ms per token,    19.78 tokens per second)
      total time =  105216.57 ms /  2091 tokens

# long output, thinking on (4096 tokens)
prompt eval time =    1664.97 ms /    43 tokens (   38.72 ms per token,    25.83 tokens per second)
       eval time =  207284.39 ms /  4096 tokens (   50.61 ms per token,    19.76 tokens per second)
      total time =  208949.37 ms /  4139 tokens
D. -ot head12+tail10 -ger 2GPU
  ggml_cuda_init: found 2 CUDA devices:

Allocating 218045 MiB of pinned host memory (HOST MEM)

# GPU VRAM:
GPU0: 57190MiB (58%)
GPU1: 48756MiB (50%)
  # short output, thinking off (64 tokens)
prompt eval time =    1111.85 ms /    30 tokens (   37.06 ms per token,    26.98 tokens per second)
       eval time =    2942.51 ms /    64 tokens (   45.98 ms per token,    21.75 tokens per second)
      total time =    4054.36 ms /    94 tokens

# long output, thinking off (2048 tokens)
prompt eval time =    2016.80 ms /    43 tokens (   46.90 ms per token,    21.32 tokens per second)
       eval time =   94650.69 ms /  2048 tokens (   46.22 ms per token,    21.64 tokens per second)
      total time =   96667.49 ms /  2091 tokens

# long output, thinking on (4096 tokens)
prompt eval time =    1431.92 ms /    43 tokens (   33.30 ms per token,    30.03 tokens per second)
       eval time =  190089.65 ms /  4096 tokens (   46.41 ms per token,    21.55 tokens per second)
      total time =  191521.57 ms /  4139 tokens
Summary
What this run made clear is that GLM-5.1 speed in the orchestrator lane is decided less by “1GPU vs 2GPU” than by “which experts are moved back onto GPU.” Full cpu-moe is stable and GPUs still run part of the path, but the dominant bottleneck is on the CPU side, and that is not enough once the orchestrator has to coexist with workers. Moving the hot head+tail layers back onto GPU materially improves TG.
The important part in practice is not to stop at “21+ t/s in a standalone benchmark,” but to carry that into a full resident layout with two Qwen3-Coder-Next Q4_0 --parallel 2 workers. Phase 0 still needs real parse-tier, convergence, and force-accept data to tell me whether I should bias further toward grandpa speed or worker quality.
Also, if I were using GLM-5.1 by itself, the current results suggest that a layout which reserves roughly 30% of the total GPU expert budget for head and tail first, then spreads the rest across the middle layers with a weighted-average mindset, is probably a strong candidate. The current measurements already show that head+tail is clearly hot, but pushing everything to the edges may still leave useful middle-layer coverage on the table.
Even a rough version of that idea seems worth testing. For the middle layers, it would be practical to try just two variants: one biased toward odd middle layers and one biased toward even middle layers, then switch between them depending on workload type. Even without full activation profiling, keeping the hot edges fixed while testing two middle-layer bias patterns looks like a cheap and informative tuning method. It is still a hypothesis, but it seems like a worthwhile next placement experiment.