Measuring Qwen3.6-27B NVFP4+MTP on vLLM: ~190 tok/s TG on Dual RTX PRO 6000 Blackwell Max-Q
Running Qwen3.6-27B-Text-NVFP4-MTP on vLLM v0.19.2rc1 with MTP speculative decoding across dual RTX PRO 6000 Blackwell 96GB GPUs, measuring TG/PP/MTP acceptance/Prefix Cache, comparing against SGLang FP8 + dynamic LoRA (where EAGLE is unusable), and recording observations on VRAM budget headroom even with LoRA adapters loaded.

On a SGLang FP8 + dynamic LoRA setup, TG was stuck around 20-30 tok/s, which was painful. To use EAGLE I would have to drop dynamic LoRA and switch to a merged or fully-finetuned model, but the model weight x N cost across multi-instance deployments makes the VRAM budget tight. So I tried sakamakismile/Qwen3.6-27B-Text-NVFP4-MTP on vLLM, with the idea of letting the agent layer manage LoRA dynamic switching while leaning on MTP speculative decoding for throughput, and verified whether the two could coexist in a multi-instance deployment.
Video link: https://www.youtube.com/watch?v=HP1Bl-h45bE
Setup
I ran sakamakismile/Qwen3.6-27B-Text-NVFP4-MTP on vLLM v0.19.2rc1 (V1 engine). GPUs are RTX PRO 6000 Max-Q Blackwell 96GB x 2, TP=2 (TP=1 was also tried but is omitted here). MTP is enabled with num_speculative_tokens=3, KV cache is FP8, and Prefix Caching and Chunked Prefill are both ON.
  podman run --rm -it \
  --name naughty \
  --pull=always \
  --publish 8001:8001 \
  --device nvidia.com/gpu=all \
  --shm-size=8g \
  -v /mnt/data/models/lora-adapters:/loras:ro \
  -v /mnt/data/models:/hf/hub:ro \
  -e HF_HOME=/hf \
  -e HF_HUB_CACHE=/hf/hub \
  -e HF_HUB_OFFLINE=1 \
  -e TRANSFORMERS_OFFLINE=1 \
  -e TORCH_CUDA_ARCH_LIST=12.0 \
  -e VLLM_TARGET_DEVICE=cuda \
  -e VLLM_USE_V1=1 \
  -e VLLM_FLASHINFER_MOE_BACKEND=throughput \
  -e VLLM_USE_FLASHINFER_MOE_FP4=1 \
  registry.home.arpa/vllm-openai:cu130-nightly-fe9c3d6 \
  sakamakismile/Qwen3.6-27B-Text-NVFP4-MTP \
    --host 0.0.0.0 \
    --port 8001 \
    --served-model-name Qwen3.6-27b-NVFP4 \
    --trust-remote-code \
    --language-model-only \
    --quantization modelopt \
    --enable-prefix-caching \
    --dtype auto \
    --tensor-parallel-size 2 \
    --gpu-memory-utilization 0.88 \
    --max-model-len 262144 \
    --max-num-seqs 8 \
    --kv-cache-dtype fp8 \
    --reasoning-parser qwen3 \
    --enable-auto-tool-choice \
    --tool-call-parser qwen3_coder \
    --default-chat-template-kwargs '{"enable_thinking": true}' \
    --speculative-config '{"method":"qwen3_5_mtp","num_speculative_tokens":3}' \
    --override-generation-config '{"temperature":1.0,"top_p":0.95,"top_k":20,"presence_penalty":0.0,"repetition_penalty":1.0}'
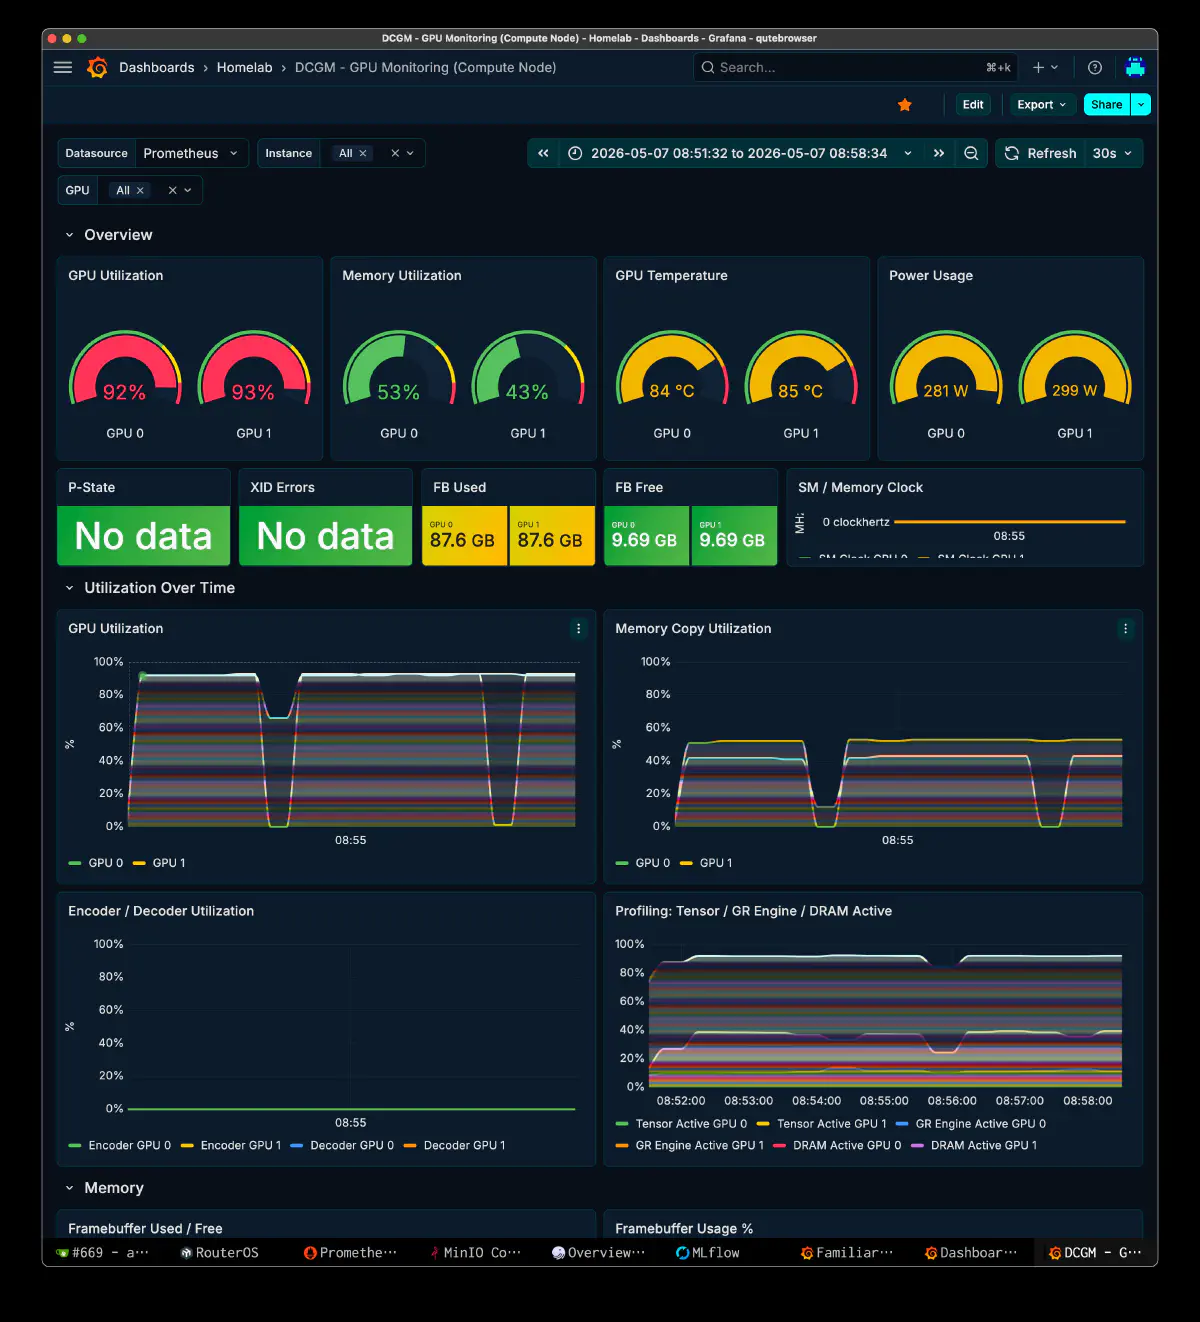
Initialization took roughly 102 seconds total: model load 1.45s (target) + 0.21s (drafter), torch.compile 45.95s + 6.97s, CUDA Graph Capture 2s. FB Used was 87.6 GB/GPU and Free was 9.69 GB/GPU. KV cache reserved 1,115,200 tokens.
LoRA Adapter (axolotl, bf16)
The LoRA used here was trained in bf16 with axolotl. The adapter is applied at runtime against the NVFP4-quantized base.
  base_model: /mnt/data/models/models--Qwen--Qwen3.6-27B/snapshots/5d316fa25c3a0b6251198e9e7a94e863a435536a
tokenizer_type: AutoTokenizer
trust_remote_code: true

datasets:
  - path: datasets/familiar-sft-v2/train.jsonl
    type: chat_template
    ds_type: json
    field_messages: messages
    roles_to_train:
      - assistant
test_datasets:
  - path: datasets/familiar-sft-v2/val.jsonl
    type: chat_template
    ds_type: json
    field_messages: messages
    roles_to_train:
      - assistant

chat_template: tokenizer_default
sequence_len: 16384
sample_packing: false
pad_to_sequence_len: false

adapter: lora
lora_r: 16
lora_alpha: 32
lora_dropout: 0.05
lora_target_modules:
  - q_proj
  - k_proj
  - v_proj
  - o_proj
  - gate_proj
  - up_proj
  - down_proj

output_dir: /mnt/data/models/lora-adapters/qwen3.6-27b-familiar-bf16-lora
save_safetensors: true
save_total_limit: 2
save_steps: 50
eval_steps: 50
logging_steps: 5

micro_batch_size: 1
gradient_accumulation_steps: 8
num_epochs: 2
learning_rate: 5.0e-5
lr_scheduler: cosine
warmup_ratio: 0.05
optimizer: adamw_torch

bf16: true
fp16: false
tf32: true
load_in_8bit: false
load_in_4bit: false
gradient_checkpointing: true
/mnt/data/models/lora-adapters is mounted into the vLLM container as :ro, and the LoRA is attached after startup. Comparing TG with and without LoRA at seq=4 came out roughly as follows (the video and the rest of this article are based on the no-LoRA x2 case).
- with LoRA: 85-95 tok/s
- without LoRA: 85-105 tok/s
Throughput Measurements
I sent Django-like agent tasks through and pulled metrics at 10-second intervals from the vLLM log.
Generation Throughput (TG)
- Mean (all): 155.7 tok/s
- Mean (active, >50 tok/s): 161.4 tok/s
- Max: 190.4 tok/s
- Min: 32.6 tok/s
- Active samples: 43 / 45
Prompt Processing (PP)
- Mean (active, >0): 831.2 tok/s
- Max: 2,773.3 tok/s
- Min (active): 226.6 tok/s
- Active samples: 28 / 45
MTP Speculative Decoding
- Mean Acceptance Length (MAL) avg: 3.64
- MAL max: 4.00
- Draft Acceptance Rate avg: 87.9%
- Draft Acceptance Rate max: 100.0%
- Draft Acceptance Rate min: 70.3%
Caching
- Prefix Cache Hit Rate: 68.7% → 91.2% (final)
- GPU KV Cache Usage max: 2.1%
In agent workloads with repeated tool-call patterns, Prefix Cache had headroom to grow and reached 91% by the end of the session. The KV cache usage staying as low as 2.1% is because max_num_seqs=8 and the access pattern was effectively close to single-stream.
GPU State (DCGM)
Values read from the live Grafana DCGM dashboard during the run.
- GPU Utilization: 92% / 93%
- Memory Utilization: 53% / 43%
- Temperature: 84°C / 85°C
- Power: 281 W / 299 W
Agent Real-Task Comparison: vLLM NVFP4 vs SGLang FP8
I ran similar tasks through my own agent system on both vLLM NVFP4+MTP (alias: naughty) and SGLang FP8 (alias: frisky). The numbers below come from the Familiar Tool Calls Grafana dashboard, comparing one session to one session.
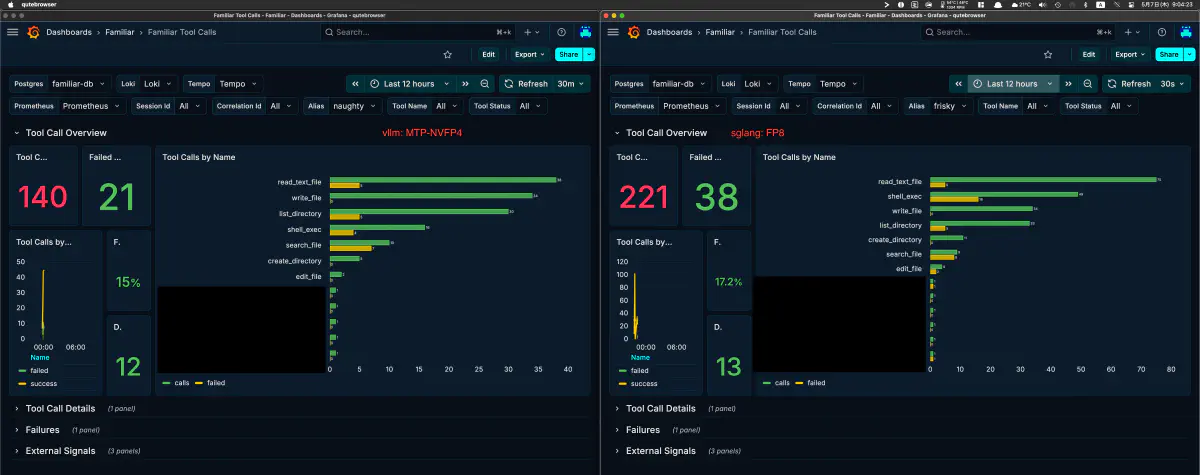
- vLLM NVFP4: 140 calls / 21 failed (15.0%)
- SGLang FP8: 221 calls / 38 failed (17.2%)
The sample is only one session and not statistically meaningful, but tool-call failure rates were not far apart. The video shows several visible tool errors on the NVFP4 side, but at the per-session granularity where the agent actually completed the run, the gap is only around 2 percentage points. NVFP4 lost steam toward the end and did not finish, while FP8 ran to completion.
Prefix Cache Diverged Across Backends Under My CTXManager
My agent layer composes context through a custom CTXManager class. Under that synthesis pattern, only vLLM showed extended periods where Prefix Cache Hit Rate stayed pinned at 0. The same workload sent to SGLang and ik_llama held steady at 0.8-1.0, which suggests the cause is not key-mismatch on the synthesis side but either vLLM’s caching behavior or one of my startup options inadvertently disabling cache somewhere. Recording it as a note.
Takeaways
- On SGLang FP8 (~30GB) without EAGLE (the configuration that prioritizes dynamic LoRA), TG sticks around 20-30 tok/s. To use EAGLE on SGLang you would split into separate instances with merged or fully-finetuned models and assign LoRA adapters per instance, which is plausible but tight on VRAM once you multiply model weights x N.
- vLLM’s MTP-NVFP4 keeps model weights at ~15GB + LoRA, so multi-instance operation does not have to compromise on the model-weight side. You also keep context space cleanly separated per instance, and it should pair well with LMCache. There are use cases where this fits.
- On the same NVFP4 base with the LoRA adapter enabled, TG was ~90 tok/s (avg), down from 161 tok/s without LoRA, but still 3-4x ahead of the 20-30 tok/s zone of SGLang FP8 + LoRA. Quality has not been evaluated, but tool-error rate did not diverge meaningfully.
- I wanted to combine this with LMCache, but NVFP4 is not yet supported there. Tracking issue: https://github.com/LMCache/LMCache/issues/3163