Step-3.7-Flash-NVFP4 as a Local Orchestrator: Multi-Agent System Development
A local-only multi-agent benchmark using Step-3.7-Flash-NVFP4 as the orchestrator and the familiar framework to generate a Django business system. The run reached a working state in about one hour and produced a fast 70% prototype.

This is a test of how far a fully local multi-agent setup can autonomously build a business system. This time I used Step-3.7-Flash-NVFP4 as the orchestrator, ran six agent roles in parallel on my own familiar framework, and had it build a restaurant reservation domain API plus an RBAC-aware admin system. No external APIs were used. Inference and measurement were both local.
The short version: Step-3.7-Flash is quite good as an orchestrator. Task decomposition and dependency resolution were stable. On the other hand, repair loops became more frequent later in the session, partly because of the guardrails. It reached an “almost working” state quickly, then spent more time on the final polish.
Video link: https://www.youtube.com/watch?v=L6ryJhd2EmA
Recent Groundwork: Generation Token Estimation and Stream Continuation
Before this benchmark, I was looking at dwarfstar commits and noticed its generation token estimation and budget-control work. That looked useful, so I brought the same idea into my own system. I extracted BackendGenerationTokenController into internal/domain/agent and introduced it together with stream continuation, a mechanism that resumes generation with a continuation prompt when output is cut by a length cap.
The motivation was simple: long reasoning sessions tend to break down near the end, and once recovery starts, quality can degrade in a cascading way. In the previous session, workers repeatedly fell into XML/TOML parse-error repair loops. I already had post-processing, but in practice it was better to synthesize a recovery point when the run looked like it was about to go bad. dwarfstar has recently been steering toward a DeepSeek-4-specialized single-model agent. I am going in the opposite direction: I want a replaceable multi-model system where I can switch aggressively to good OSS models as they appear. Even so, the problems we are working on are very similar.
What I borrowed was the idea of a send-free observation and control component. BackendGenerationTokenController does four things:
- Watches OpenAI-compatible stream chunks and estimates generated completion tokens with the existing token estimator
- Detects overrun against
max_tokens/context-window limits - Returns control decisions such as continue / cutoff / repair-needed / terminal
- Detects malformed tool arguments at tool-call finish time, including cases where usable content can be salvaged from thinking output
Prompt synthesis, continuation prompts, repair prompts, final-response synthesis, and telemetry aggregation remain outside the controller on the agent side. The controller itself is only a state machine that watches the stream and returns decisions.
I also adjusted dynamic sampling per role. Since stream continuation can now recover from a length cap, I lowered max_output_tokens, narrowed sampling, and reduced stalls in long reasoning/output. For tester, I used repetition_penalty 1.08 with lower temperature/top_p to reduce empty verification loops.
Setup
| Item | Value |
|---|---|
| Orchestrator | Step-3.7-Flash-NVFP4 on vLLM |
| Framework | Custom Go (Gin) + Rust MCP tools |
| roles | orchestrator / planner / coder / tester / reviewer / integrator |
| Task | Restaurant Domain Spec |
| CPU | AMD EPYC 9175F 16C |
| GPU | NVIDIA RTX PRO 6000 Blackwell Max-Q 96GB x 2 |
The model is replaceable, and the system can coordinate up to three models. In this run I used a single model, Step-3.7-Flash, with role sessions sharing both orchestrator and worker responsibilities. In my experience, using fewer coordinated models tends to improve both success rate and token cost. I think this is because models trained on different distributions struggle to maintain shared context. If the roles are loosely coupled, choosing separate models per role can still work, but a single-model setup is much easier. If I use multiple models, a sub-10B model specialized for a narrow job through Rust Ort/ONNX is often easier to control because the effective scope is smaller.
The main vLLM runtime configuration was:
  Exec=/models/snapshots/36afbf6e15100cdc2d7a5b79d7e95d276ed33679 \
    --host 0.0.0.0 \
    --port 8000 \
    --served-model-name grandpa \
    --gpu-memory-utilization 0.92 \
    --tensor-parallel-size 2 \
    --max-num-seqs 8 \
    --kv-cache-dtype fp8 \
    --max-model-len 147456 \
    --disable-cascade-attn \
    --enable-expert-parallel \
    --trust-remote-code \
    --quantization modelopt \
    --reasoning-parser step3p5 \
    --tool-call-parser step3p5 \
    --enable-auto-tool-choice \
    --enable-expert-parallel \
    --async-scheduling
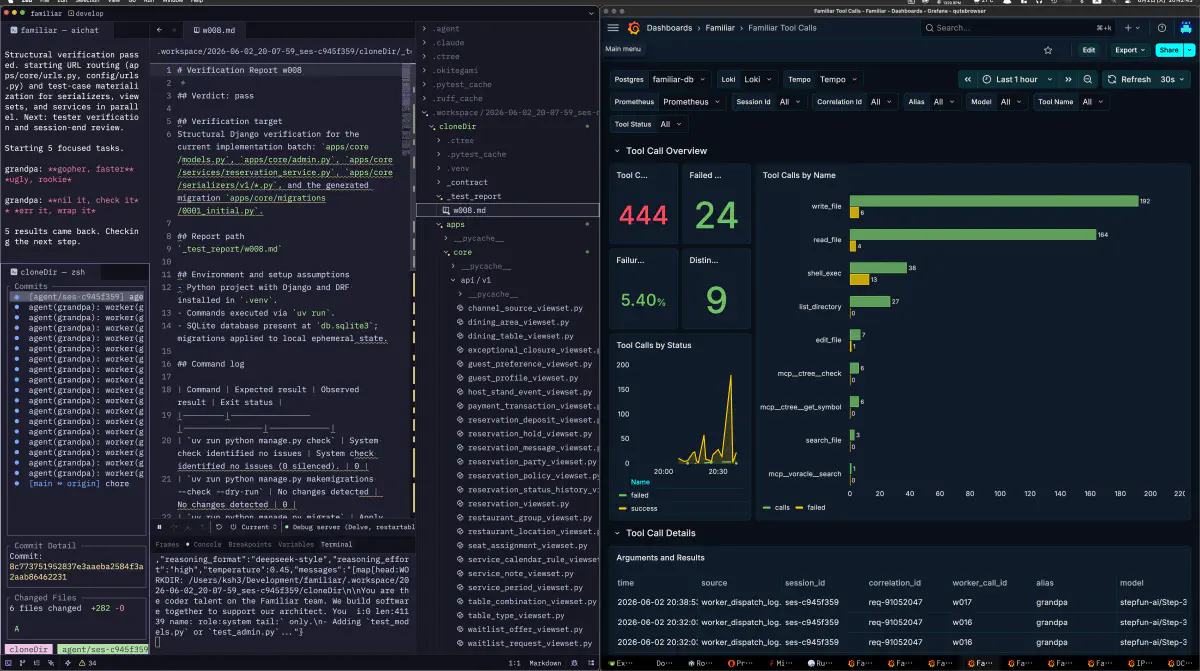
The observability stack is Grafana + Prometheus / Loki / PostgreSQL / Vector / Tempo / Alloy. I watch the dedicated dashboards while having Claude/Codex debug in real time, then feed findings back into implementation.
vLLM Interval Benchmark
| window end | completed reqs in window | running | PP tok/s | TG tok/s | KV usage | prefix hit |
|---|---|---|---|---|---|---|
| 11:39:14 | 3 | 3 | 3242.7 | 153.9 | 1.8% | 81.5% |
| 11:39:24 | 4 | 3 | 140.7 | 196.7 | 1.8% | 81.7% |
| 11:39:34 | 2 | 2 | 34.7 | 201.1 | 1.5% | 81.7% |
| 11:39:44 | 2 | 2 | 217.3 | 154.6 | 1.5% | 81.8% |
Aggregated:
| metric | avg | median | min | max |
|---|---|---|---|---|
| PP tok/s | 908.9 | 179.0 | 34.7 | 3242.7 |
| TG tok/s | 176.6 | 175.7 | 153.9 | 201.1 |
| Running | 2.5 | 2.5 | 2 | 3 |
| Prefix hit | 81.7% | 81.7% | 81.5% | 81.8% |
This is an seq=8 configuration, but it is close to the batch behavior I ran with a soft cap of 7.
Single-request measurements are separate, and the benchmark is included in the video description.
Video link: https://www.youtube.com/watch?v=NDhzjHW-2SM
Running the Session
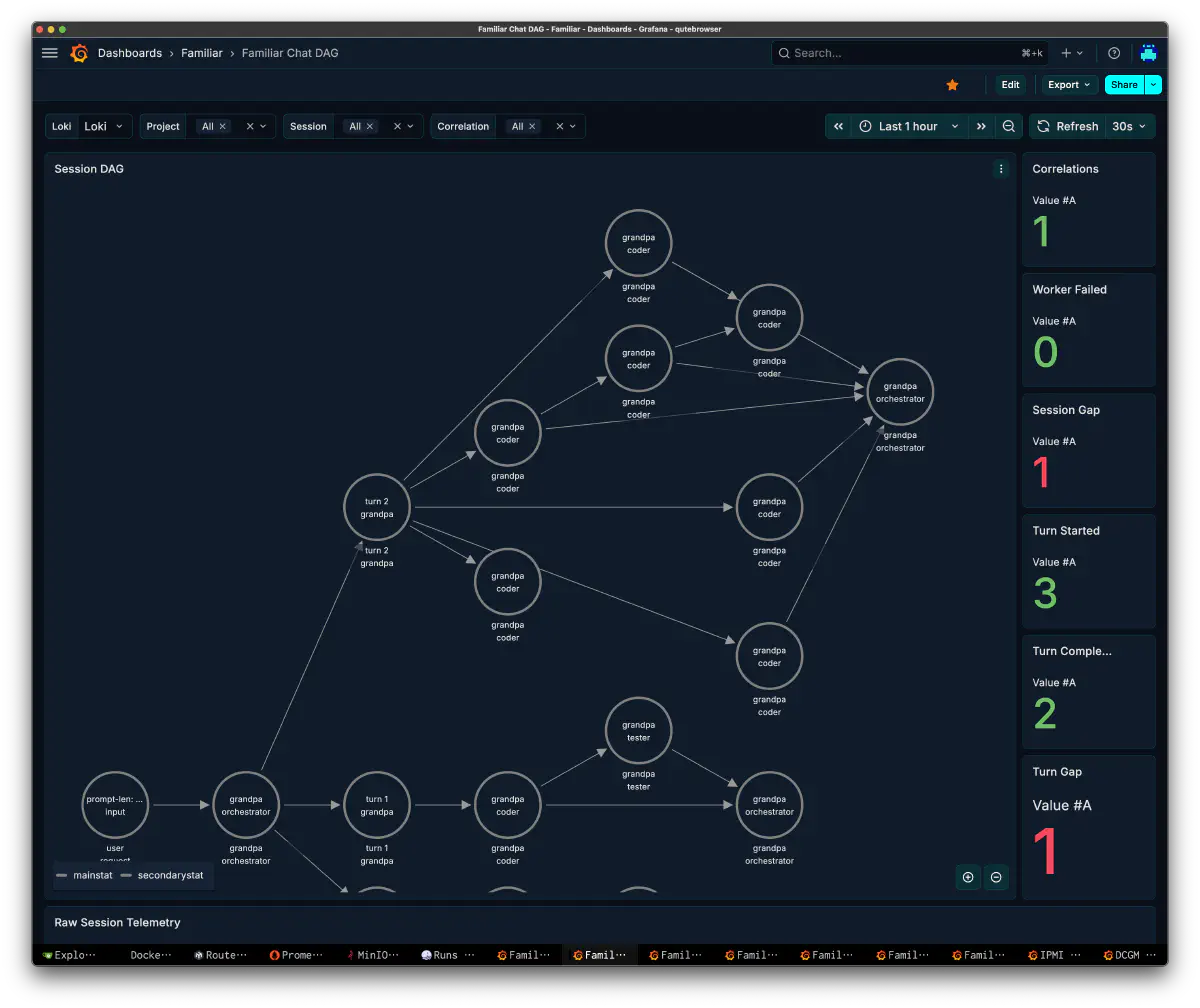
Chat DAG: Conversation Shape
The session conversation itself is visualized as a DAG through vector/loki before the datastore is finalized. It lets me follow the flow from user request -> orchestrator -> Scheduler Decisions -> Dependencies -> worker -> orchestrator and see which worker was spawned from which turn.
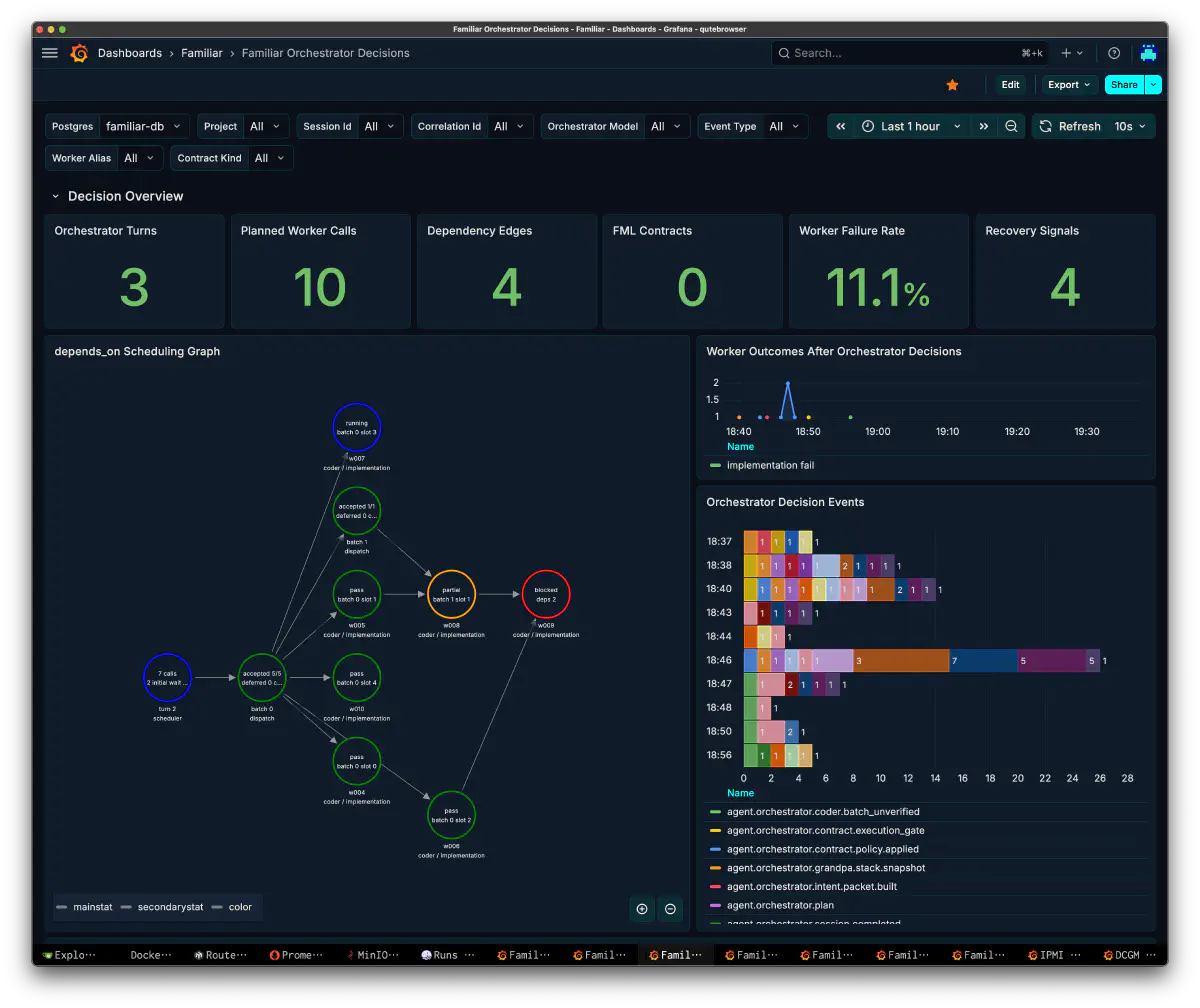
Orchestrator Decisions: Inside the Decisions
This dashboard breaks down orchestrator decisions.
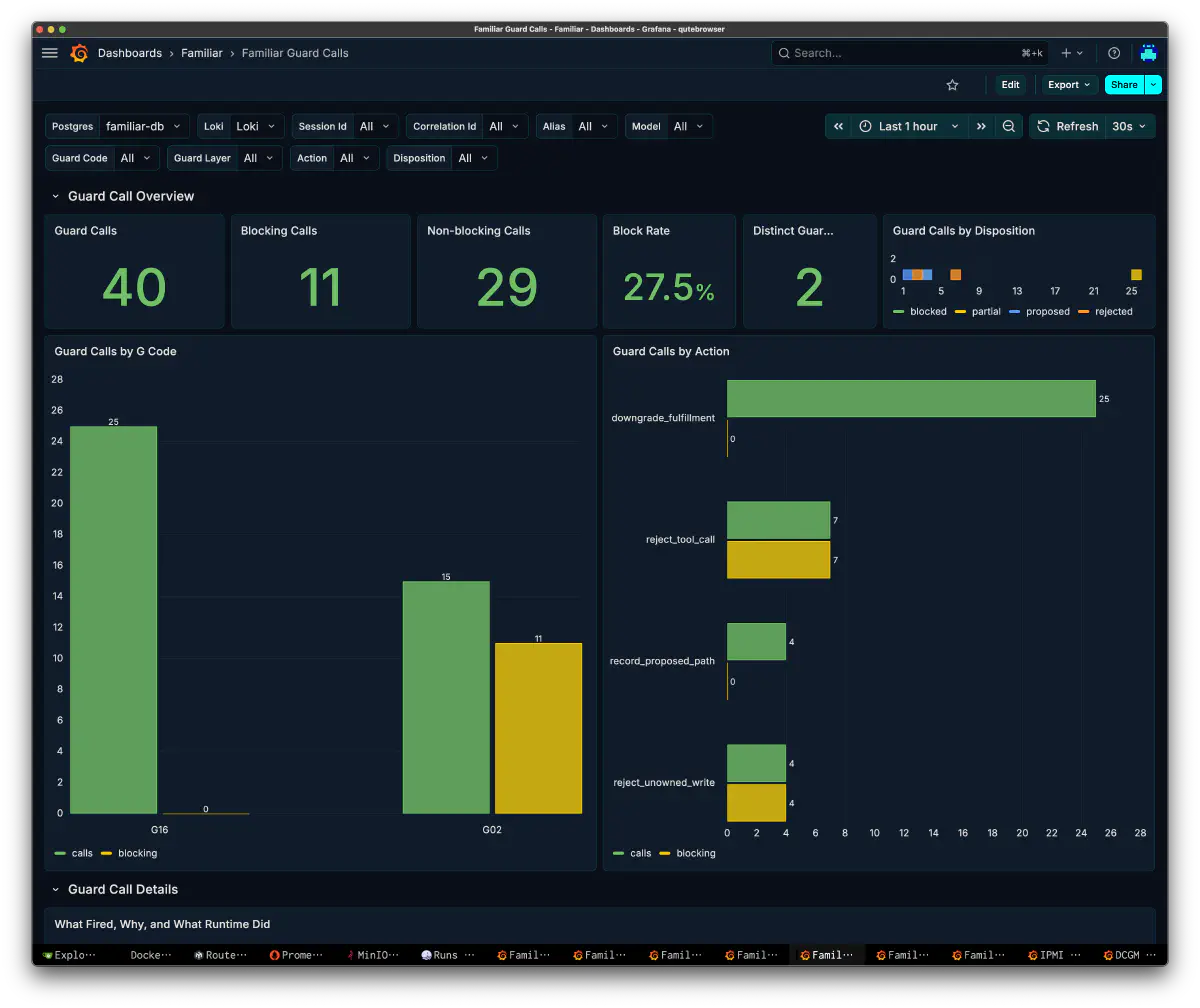
Guard Calls: Blocking and Recovering from Unsafe Behavior
The system has a Guard layer that stops or redirects agent behavior at runtime. In this session there were 40 Guard Calls: 11 blocking, 29 non-blocking, with a Block Rate of 27.5%.
| Action | calls | blocking |
|---|---|---|
| downgrade_fulfillment | 25 | 0 |
| reject_tool_call | 7 | 7 |
| record_proposed_path | 4 | 0 |
| reject_unowned_write | 4 | 4 |
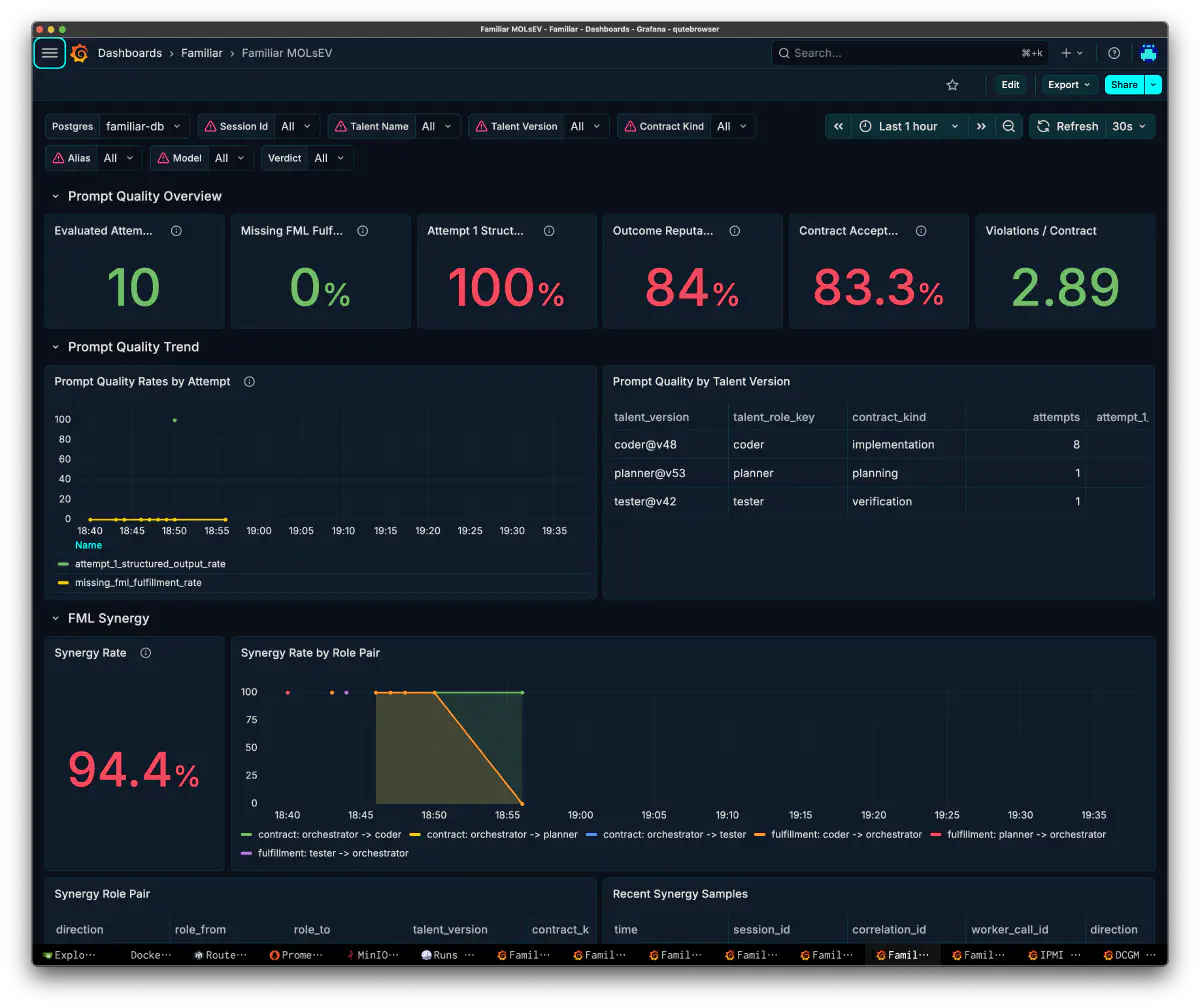
MOLsEV: Prompt Quality and Role Synergy
Result
It took about one hour to reach a fully working state. The “mostly working” state, roughly 70%, came in about 24 minutes. The first half moved fast, and the final tightening took more time.
Out of seven deliverables, about two passed command-based startup without manual edits.
- Django admin worked as-is
- The API worked
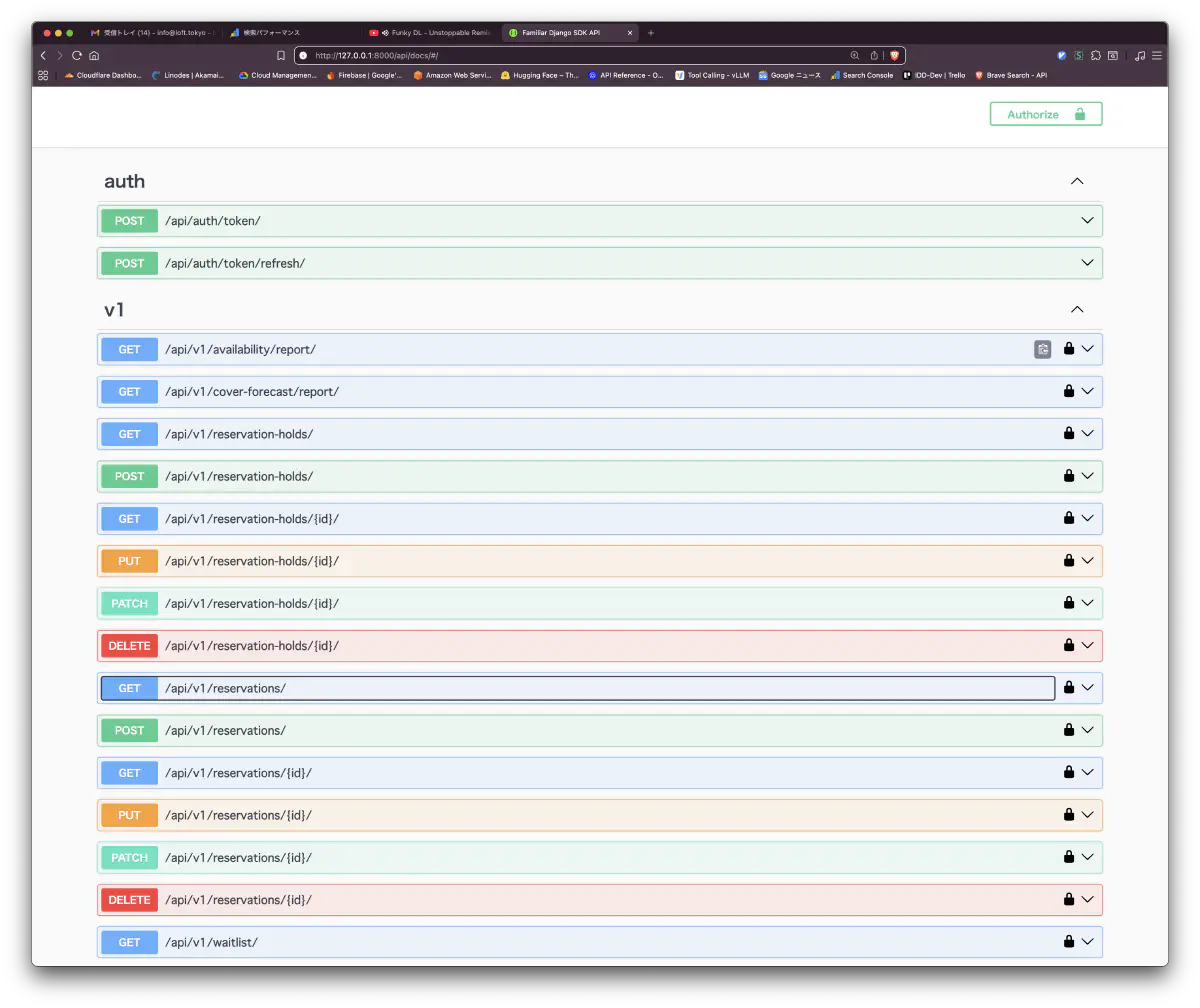
api/docs, the Swagger UI, was generated with auth and v1 resources listed- Seed data was loaded
The remaining five needed light fixes. Opening api/docs showed realistic domain resources such as auth/token, reservations, reservation-holds, waitlist, availability/report, and cover-forecast/report, including both CRUD and report-style endpoints.
Notes
Step-3.7-Flash is quite good as a local orchestrator. Step-3.5 was already strong for orchestration, but this is better. Task decomposition and dependency resolution were stable, and the Attempt-1 structured-output rate of 100% shows that it follows the wire format well. In the vLLM interval aggregation, TG averaged 176.6 tok/s, with a median of 175.7 tok/s and a range of 153.9-201.1 tok/s. Prefix cache hit rate stayed stable at 81.5-81.8%. The context-window manager kept roughly 70-90%, and my own ctxMgr was able to grow the cache across role sessions while keeping it around 80%.
In my environment, MTP did not work with NVFP4. SGLang with cu13 also failed because it only supported up to SM100. I tried GGUF through ik_llama as well, but crashes and output quality were unstable.
Roughly 70% of the development of this benchmark environment and dashboard set was done through Claude/Codex. What I mainly ask them to do is design and outline implementation. I spend more of my own time turning ideas from walks into experiments, watching observability dashboards, finding hypotheses, and feeding those back into implementation. If observability is built first, this hypothesis -> implementation loop becomes much faster, so I think that is the part to prepare first.